Labor market — Australia
Participation rate in Australia
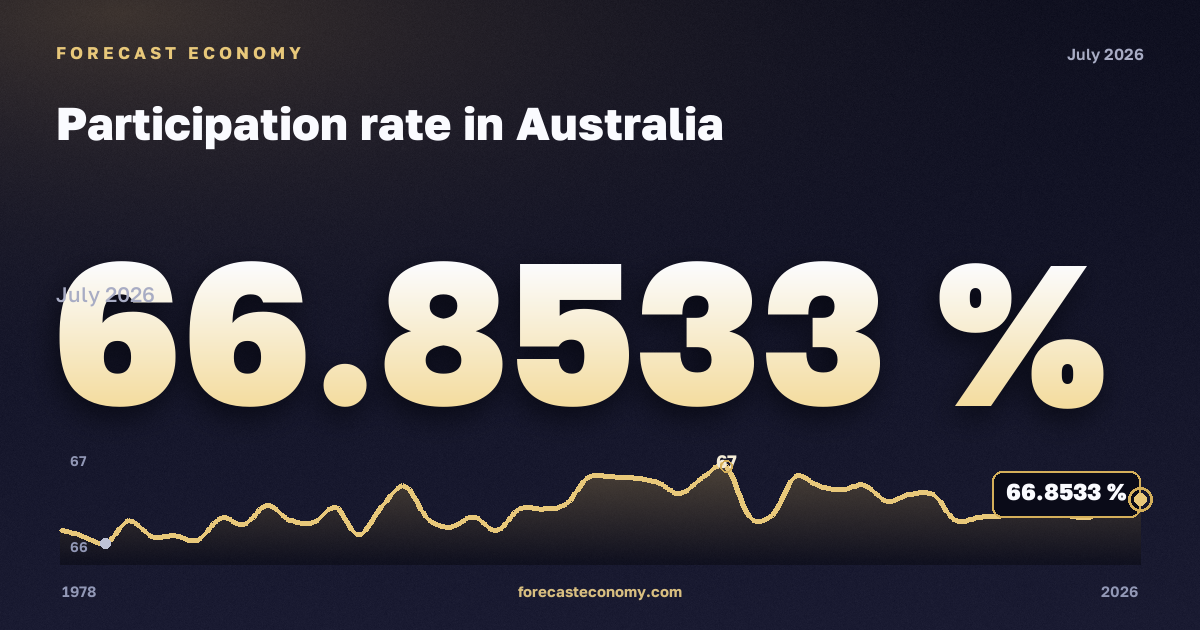
Latest value66.8533 %
DateJuly 2026
Period1978–2026
Data sourceAustralian Bureau of Statistics
Participation rate in Australia: latest value 66.8533 % as of July 2026.
Participation rate in Australia — official series from Australian Bureau of Statistics. The chart shows dynamics over the available observation period; values are shown in %.
Observation period: 1978–2026, published monthly. Source — Australian Bureau of Statistics.
Frequency
Monthly.
Latest values
| Period | % |
|---|---|
| July 2026 | 66.8533 |
| June 2026 | 67.0109 |
| May 2026 | 66.6931 |
| April 2026 | 66.6793 |
| March 2026 | 66.7747 |
| February 2026 | 66.8196 |
| January 2026 | 66.6849 |
| December 2025 | 66.667 |
| November 2025 | 66.6301 |
| October 2025 | 66.8979 |
| September 2025 | 66.9028 |
| August 2025 | 66.8308 |
| July 2025 | 66.9969 |
| June 2025 | 66.9492 |
| May 2025 | 66.9901 |
| April 2025 | 67.0858 |
| March 2025 | 66.6892 |
| February 2025 | 66.6738 |
| January 2025 | 67.1903 |
| December 2024 | 67.082 |
| November 2024 | 66.9114 |
| October 2024 | 67.0241 |
| September 2024 | 67.0713 |
| August 2024 | 67.0827 |
More in “Labor market” — Australia
Data source
Australian Bureau of Statistics. Units: %. Observation period: 1978–2026.
Data as of July 2026
Russia
Russian macro indicators — on the home page and in comparison.