Prices and inflation — Brazil
IPCA 12-month accumulated change in Brazil
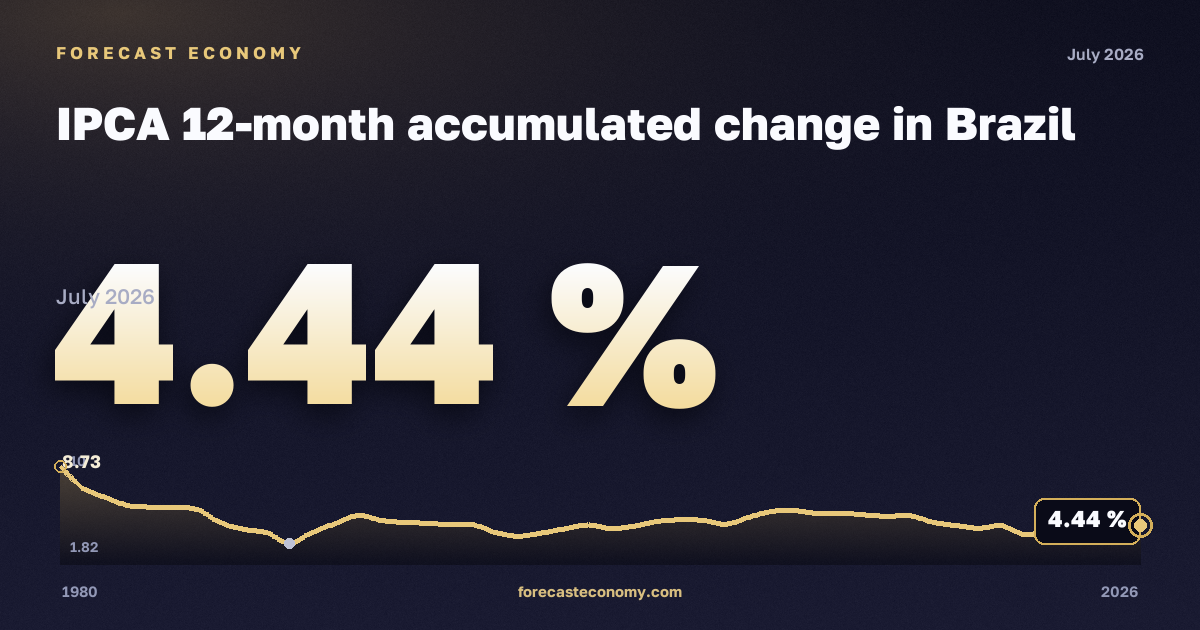
Latest value4.44 %
DateJuly 2026
Period1980–2026
Data sourceCentral Bank of Brazil
IPCA 12-month accumulated change in Brazil: latest value 4.44 % as of July 2026.
IPCA 12-month accumulated change in Brazil — official series from Central Bank of Brazil. The chart shows dynamics over the available observation period; values are shown in %.
Observation period: 1980–2026, published monthly. Source — Central Bank of Brazil.
Frequency
Monthly.
Latest values
| Period | % |
|---|---|
| July 2026 | 4.44 |
| June 2026 | 4.64 |
| May 2026 | 4.72 |
| April 2026 | 4.39 |
| March 2026 | 4.14 |
| February 2026 | 3.81 |
| January 2026 | 4.44 |
| December 2025 | 4.26 |
| November 2025 | 4.46 |
| October 2025 | 4.68 |
| September 2025 | 5.17 |
| August 2025 | 5.13 |
| July 2025 | 5.23 |
| June 2025 | 5.35 |
| May 2025 | 5.32 |
| April 2025 | 5.53 |
| March 2025 | 5.48 |
| February 2025 | 5.06 |
| January 2025 | 4.56 |
| December 2024 | 4.83 |
| November 2024 | 4.87 |
| October 2024 | 4.76 |
| September 2024 | 4.42 |
| August 2024 | 4.24 |
More in “Prices and inflation” — Brazil
Data source
Central Bank of Brazil. Units: %. Observation period: 1980–2026.
Data as of July 2026
Russia
Russian macro indicators — on the home page and in comparison.