GDP and growth — Brazil
Real GDP chain index (seasonally adjusted) in Brazil
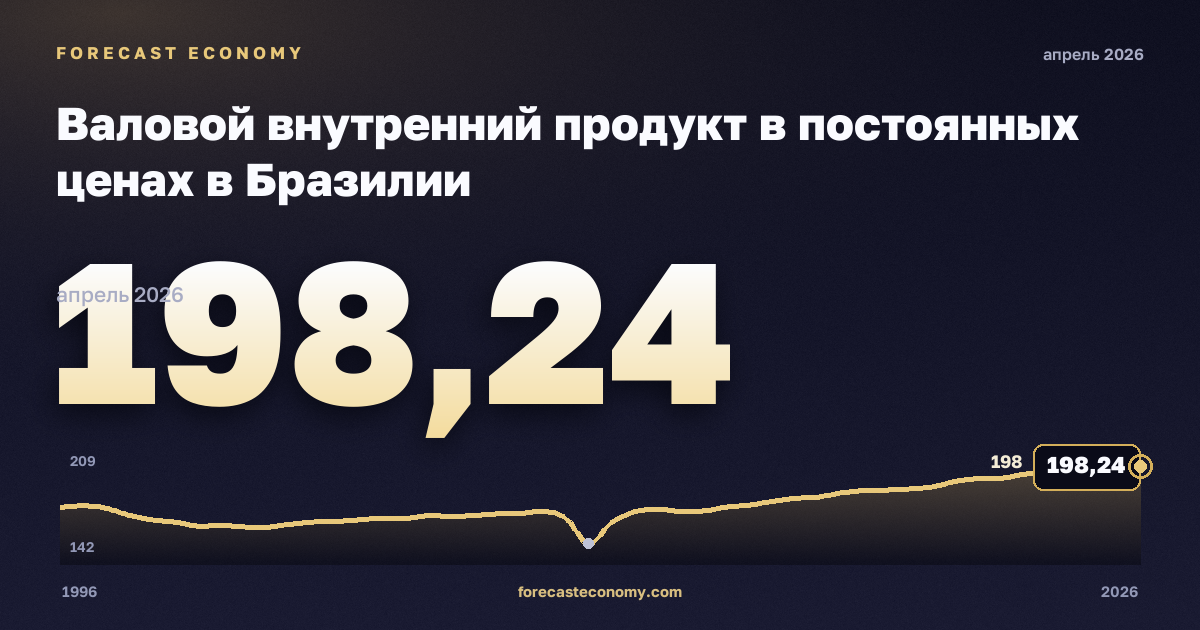
Latest value197.34
DateJanuary 2026
Period1996–2026
Data sourceCentral Bank of Brazil
Real GDP chain index (seasonally adjusted) in Brazil: latest value 197.34 as of January 2026.
Real GDP chain index (seasonally adjusted) in Brazil — official series from Central Bank of Brazil. The chart shows dynamics over the available observation period; values are shown in индекс (среднее 1995 = 100).
Observation period: 1996–2026, published quarterly. Source — Central Bank of Brazil.
Frequency
Quarterly.
Latest values
| Period | индекс (среднее 1995 = 100) |
|---|---|
| January 2026 | 197.34 |
| October 2025 | 195.19 |
| July 2025 | 194.69 |
| April 2025 | 194.5 |
| January 2025 | 193.84 |
| October 2024 | 191.41 |
| July 2024 | 191.23 |
| April 2024 | 189.52 |
| January 2024 | 186.4 |
| October 2023 | 185.14 |
| July 2023 | 184.43 |
| April 2023 | 184.19 |
| January 2023 | 182.77 |
| October 2022 | 180.35 |
| July 2022 | 179.58 |
| April 2022 | 177.7 |
| January 2022 | 175.7 |
| October 2021 | 174.5 |
| July 2021 | 172.2 |
| April 2021 | 171.94 |
| January 2021 | 173.15 |
| October 2020 | 171.65 |
| July 2020 | 165.31 |
| April 2020 | 153.17 |
More in “GDP and growth” — Brazil
Data source
Central Bank of Brazil. Units: индекс (среднее 1995 = 100). Observation period: 1996–2026.
Data as of January 2026
Russia
Russian macro indicators — on the home page and in comparison.