Government finance — China
General government gross debt in China
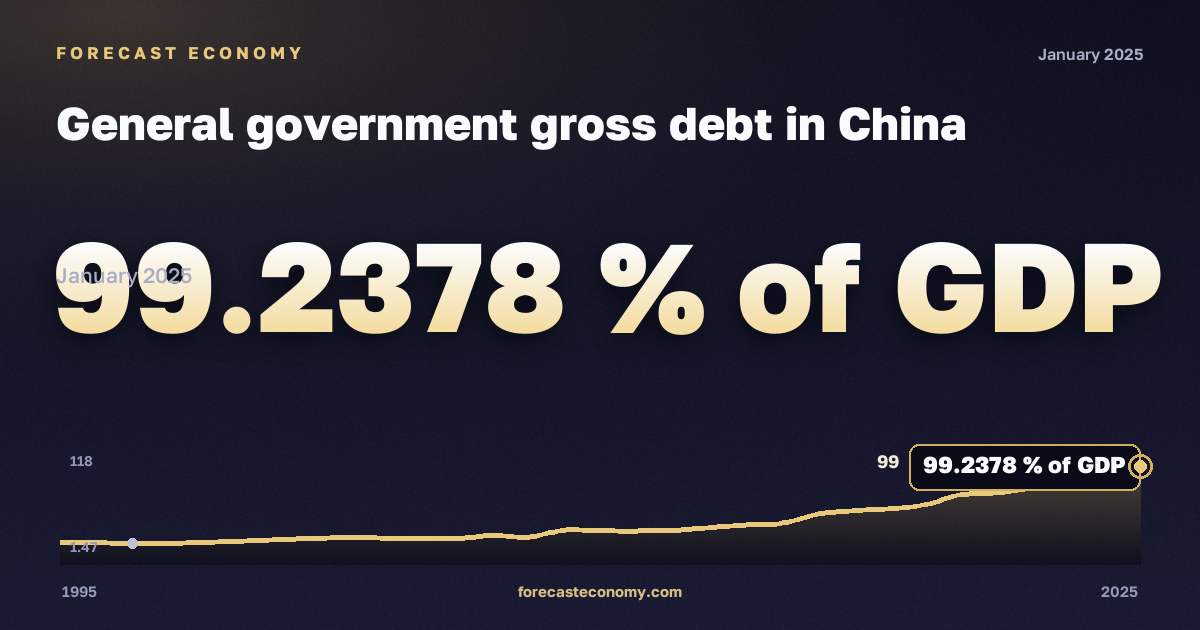
Latest value99.2378 % of GDP
Date2025
Period1995–2025
Data sourceInternational Monetary Fund
General government gross debt in China: latest value 99.2378 % of GDP as of 2025.
General government gross debt in China — official series from International Monetary Fund. The chart shows dynamics over the available observation period; values are shown in % ВВП.
Observation period: 1995–2025, published annually. Source — International Monetary Fund.
Frequency
Annual.
Latest values
| Period | % ВВП |
|---|---|
| 2025 | 99.2378 |
| 2024 | 90.421 |
| 2023 | 84.0837 |
| 2022 | 77.2936 |
| 2021 | 72.1309 |
| 2020 | 70.134 |
| 2019 | 59.8382 |
| 2018 | 55.8753 |
| 2017 | 53.891 |
| 2016 | 50.0327 |
| 2015 | 40.7816 |
| 2014 | 39.3078 |
| 2013 | 36.4377 |
| 2012 | 33.8252 |
| 2011 | 33.1841 |
| 2010 | 33.3432 |
| 2009 | 33.9848 |
| 2008 | 26.715 |
| 2007 | 28.7077 |
| 2006 | 25.1736 |
| 2005 | 25.91 |
| 2004 | 25.9999 |
| 2003 | 26.418 |
| 2002 | 25.5531 |
More in “Government finance” — China
Data source
International Monetary Fund. Units: % ВВП. Observation period: 1995–2025.
Data for 2025
Russia
Russian macro indicators — on the home page and in comparison.