Population — Germany
Fertility indicators in Germany
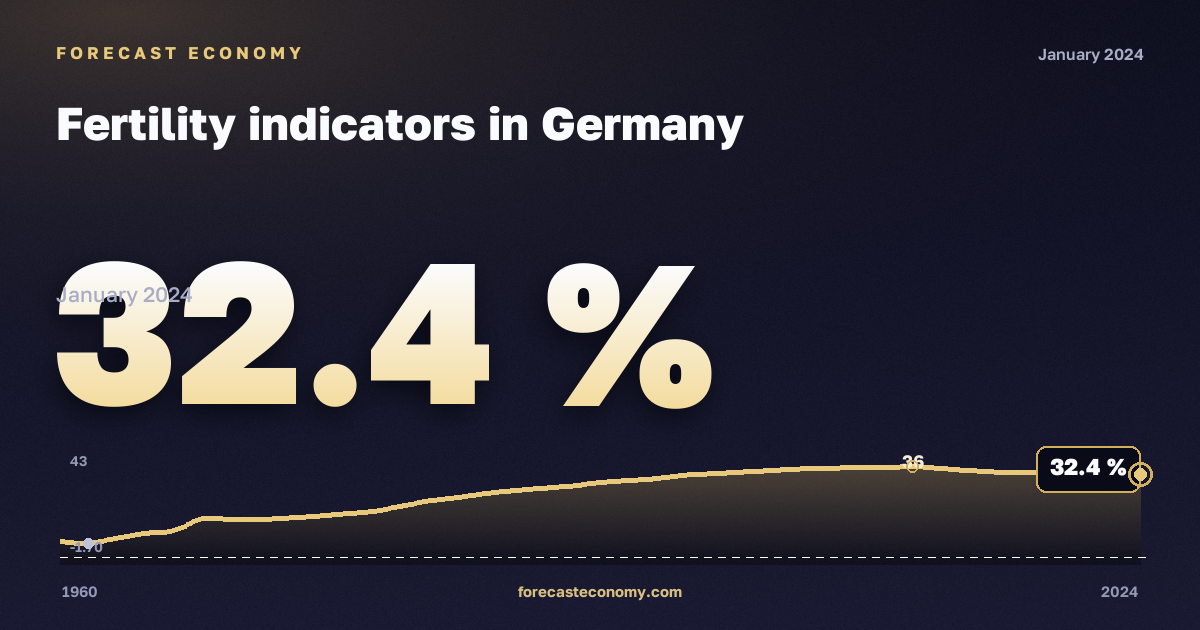
Latest value32.4 %
Date2024
Period1960–2024
Data sourceEurostat
Fertility indicators in Germany: latest value 32.4 % as of 2024.
Fertility indicators in Germany — official series from Eurostat. The chart shows dynamics over the available observation period; values are shown in %.
Observation period: 1960–2024, published annually. Source — Eurostat.
Frequency
Annual.
Latest values
| Period | % |
|---|---|
| 2024 | 32.4 |
| 2023 | 33.1 |
| 2022 | 33.5 |
| 2021 | 32.8 |
| 2020 | 33.1 |
| 2019 | 33.3 |
| 2018 | 33.9 |
| 2017 | 34.7 |
| 2016 | 35.5 |
| 2015 | 35 |
| 2014 | 35 |
| 2013 | 34.8 |
| 2012 | 34.5 |
| 2011 | 33.9 |
| 2010 | 33.3 |
| 2009 | 32.7 |
| 2008 | 32.1 |
| 2007 | 30.8 |
| 2006 | 30 |
| 2005 | 29.2 |
| 2004 | 27.9 |
| 2003 | 27 |
| 2002 | 26.1 |
| 2001 | 25 |
This indicator in other countries
- Fertility indicators — Austria
- Fertility indicators — Bulgaria
- Fertility indicators — Croatia
- Fertility indicators — Czechia
- Fertility indicators — Finland
- Fertility indicators — France
- Fertility indicators — Greece
- Fertility indicators — Hungary
- Fertility indicators — Italy
- Fertility indicators — Latvia
- Fertility indicators — Lithuania
- Fertility indicators — Luxembourg
More in “Population” — Germany
- Marriages by sex and previous marital status
- Marriages by sex and previous marital status
- Population change - Demographic balance and crude rates at national level
- Population change - Demographic balance and crude rates at national level
- Population change - Demographic balance and crude rates at national level
- Population change - Demographic balance and crude rates at regional level (NUTS 3)
- Population change - Demographic balance and crude rates at regional level (NUTS 3)
- Excess mortality by month
- Infant mortality rates
- Fertility rates by age and NUTS 2 region
- Fertility rates by age and NUTS 2 region
- Fertility rates by age
Data source
Eurostat. Units: %. Observation period: 1960–2024.
Data for 2024
Russia
Russian macro indicators — on the home page and in comparison.