Society — Moldova
Energy import dependency by products in Moldova
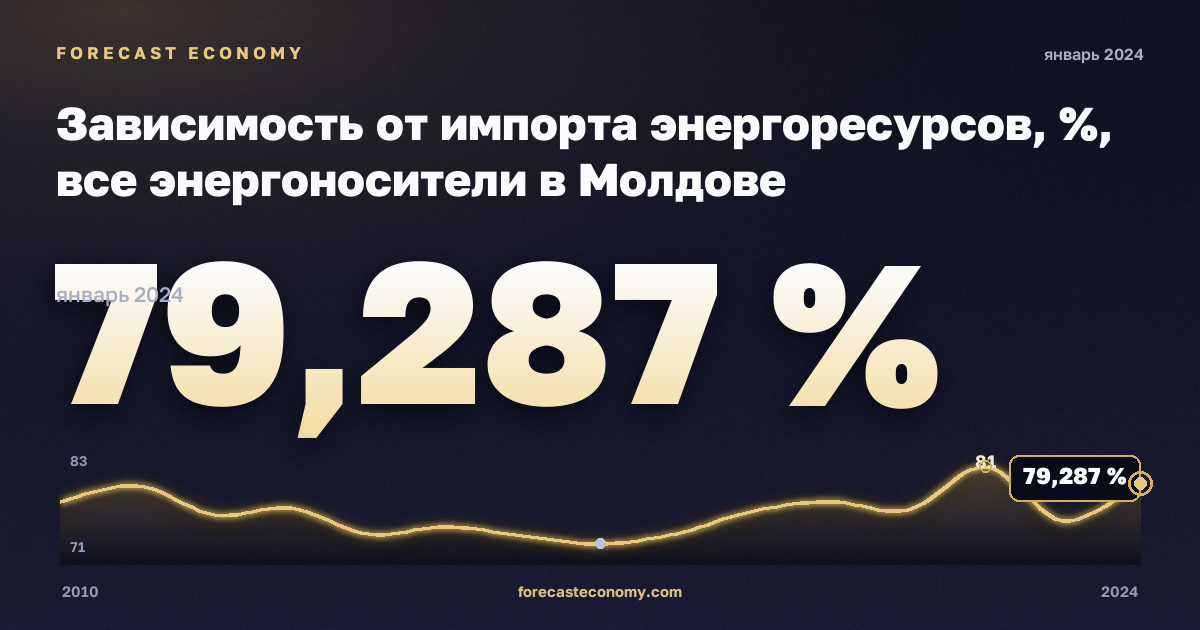
Latest value79.287 %
Date2024
Period2010–2024
Data sourceEurostat
Energy import dependency by products in Moldova: latest value 79.287 % as of 2024.
Energy import dependency by products in Moldova — official series from Eurostat. The chart shows dynamics over the available observation period; values are shown in %.
Observation period: 2010–2024, published annually. Source — Eurostat.
Frequency
Annual.
Latest values
| Period | % |
|---|---|
| 2024 | 79.287 |
| 2023 | 75.553 |
| 2022 | 81 |
| 2021 | 76.636 |
| 2020 | 77.476 |
| 2019 | 76.561 |
| 2018 | 74.252 |
| 2017 | 73.19 |
| 2016 | 73.996 |
| 2015 | 74.932 |
| 2014 | 74.185 |
| 2013 | 76.802 |
| 2012 | 76.133 |
| 2011 | 79.091 |
| 2010 | 77.475 |
This indicator in other countries
More in “Society” — Moldova
- Share of renewable energy in gross final energy consumption by sector
- Share of renewable energy in gross final energy consumption by sector
- Share of renewable energy in gross final energy consumption by sector
- Share of renewable energy in gross final energy consumption by sector
- Proportion of population aged 65 and over
- Final energy consumption in households per capita
- Old-age-dependency ratio
- Population by age group
- Population change - crude rates of total change, natural change and net migration plus adjustment
- Live births and crude birth rate
- Deaths and crude death rate
Data source
Eurostat. Units: %. Observation period: 2010–2024.
Data for 2024
Russia
Russian macro indicators — on the home page and in comparison.