Society — Poland
Population connected to at least secondary wastewater treatment in Poland
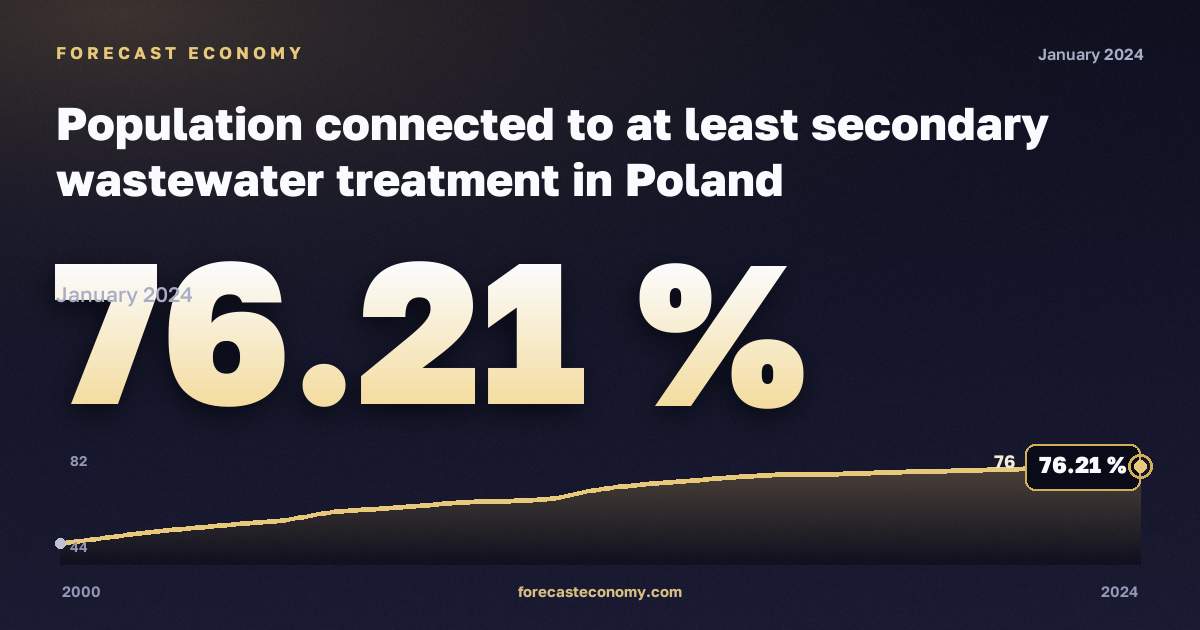
Latest value76.21 %
Date2024
Period2000–2024
Data sourceEurostat
Population connected to at least secondary wastewater treatment in Poland: latest value 76.21 % as of 2024.
Population connected to at least secondary wastewater treatment in Poland — official series from Eurostat. The chart shows dynamics over the available observation period; values are shown in %.
Observation period: 2000–2024, published annually. Source — Eurostat.
Frequency
Annual.
Latest values
| Period | % |
|---|---|
| 2024 | 76.21 |
| 2023 | 75.89 |
| 2022 | 75.68 |
| 2021 | 75.2 |
| 2020 | 74.78 |
| 2019 | 74.44 |
| 2018 | 74 |
| 2017 | 73.5 |
| 2016 | 73.4 |
| 2015 | 72.6 |
| 2014 | 71.4 |
| 2013 | 70.2 |
| 2012 | 68.5 |
| 2011 | 65.5 |
| 2010 | 64.5 |
| 2009 | 64.1 |
| 2008 | 62.9 |
| 2007 | 61.8 |
| 2006 | 60.7 |
| 2005 | 58.1 |
| 2004 | 56.8 |
| 2003 | 55.5 |
| 2002 | 54 |
| 2001 | 52.1 |
This indicator in other countries
- Population connected to at least secondary wastewater treatment — Belgium
- Population connected to at least secondary wastewater treatment — Bulgaria
- Population connected to at least secondary wastewater treatment — Czechia
- Population connected to at least secondary wastewater treatment — Denmark
- Population connected to at least secondary wastewater treatment — Estonia
- Population connected to at least secondary wastewater treatment — Finland
- Population connected to at least secondary wastewater treatment — France
- Population connected to at least secondary wastewater treatment — Greece
- Population connected to at least secondary wastewater treatment — Hungary
- Population connected to at least secondary wastewater treatment — Ireland
- Population connected to at least secondary wastewater treatment — Latvia
- Population connected to at least secondary wastewater treatment — Lithuania
More in “Society” — Poland
- Purchasing power adjusted GDP per capita
- General government gross debt
- Health graduates
- Graduates in tertiary education by age groups - per 1000 of population aged 20-29
- Graduates in tertiary education, in science, math., computing, engineering, manufacturing, construction, by sex - per 1000 of population aged 20-29
- Graduates at doctoral level by sex and age groups - per 1000 of population aged 25-34
- Gender employment gap, by type of employment
- Government support to agricultural research and development
- Jobless households - children
- Children living in households with very low work intensity by educational attainment level of their parents (population aged 0 to 17 years) - EU 2020 strategy
- Share of buses and trains in inland passenger transport
- Share of rent related to occupied dwelling in disposable household income, by type of household and income group
Data source
Eurostat. Units: %. Observation period: 2000–2024.
Data for 2024
Russia
Russian macro indicators — on the home page and in comparison.