Copper in Russia, 2026
Copper in 2026 (year-to-date through 1 July 2026): 7 values, Annual average (as of 1 July 2026) — 13,154.43 USD/t. Official data — World Bank.
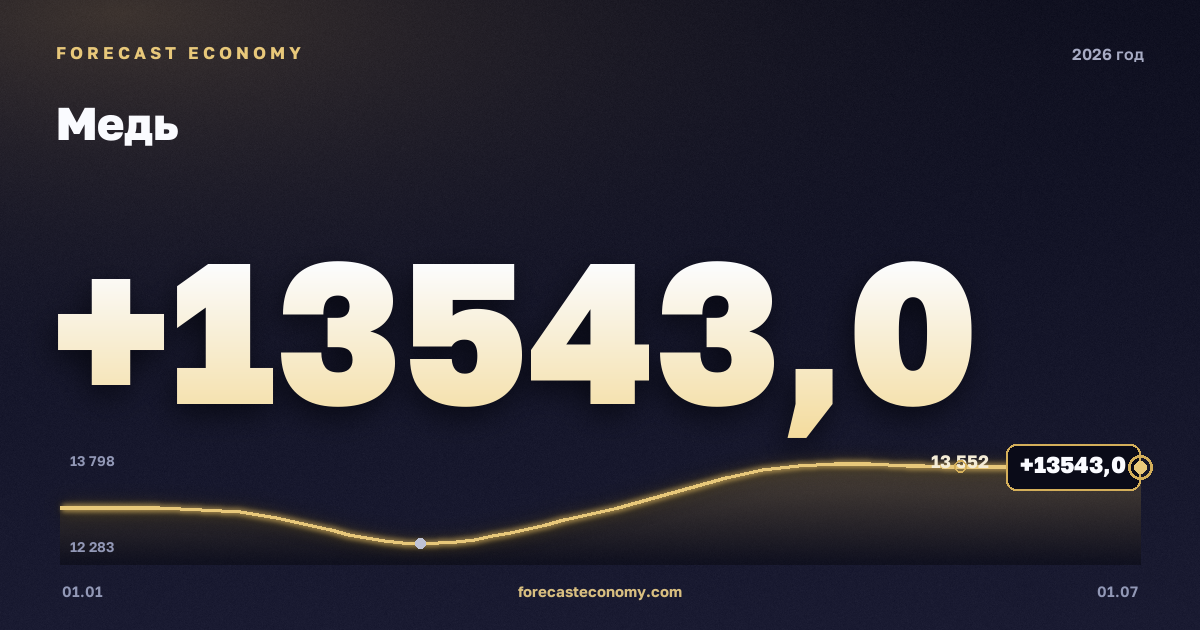
Copper in 2026: year-to-date data
- Annual average (as of 1 July 2026): 13,154.43 USD/t
- Value at start of year: 13,012 USD/t (1 January 2026)
- Latest value: 13,543 USD/t (1 July 2026)
- Minimum and maximum: 12,529 … 13,552 USD/t
- Number of observations: 7
- Source: World Bank
All values for 2026
| Date | Value, USD/t |
|---|---|
| 1 January 2026 | 13,012 |
| 1 February 2026 | 12,951 |
| 1 March 2026 | 12,529 |
| 1 April 2026 | 12,951 |
| 1 May 2026 | 13,543 |
| 1 June 2026 | 13,552 |
| 1 July 2026 | 13,543 |
Chart and forecast
Full history, interactive chart and forecast — on the Copper page.