Industrial production: water supply in Russia, 2021
Industrial production: water supply in 2021: 12 values, Year-end value — 116.3 index. Official data — Rosstat.
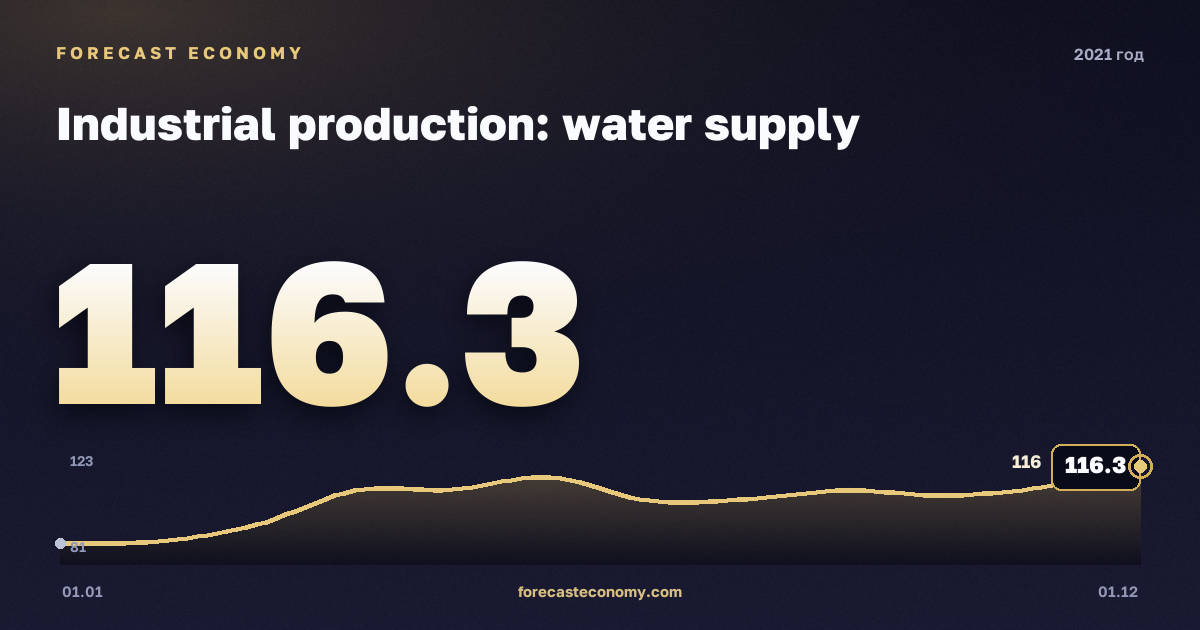
2021 totals
- Year-end value: 116.3 index
- Value at start of year: 87.7 index (1 January 2021)
- Value at end of year: 116.3 index (1 December 2021)
- Minimum and maximum: 87.7 … 116.3 index
- Number of observations: 12
- Source: Rosstat
All values for 2021
| Date | Value, index |
|---|---|
| 1 January 2021 | 87.7 |
| 1 February 2021 | 88.4 |
| 1 March 2021 | 94.6 |
| 1 April 2021 | 107.2 |
| 1 May 2021 | 107.7 |
| 1 June 2021 | 112.3 |
| 1 July 2021 | 103.6 |
| 1 August 2021 | 104.1 |
| 1 September 2021 | 107.4 |
| 1 October 2021 | 105.5 |
| 1 November 2021 | 108.5 |
| 1 December 2021 | 116.3 |
Chart and forecast
Full history, interactive chart and forecast — on the Industrial production: water supply page.
Other years
- Industrial production: water supply in 2015
- Industrial production: water supply in 2016
- Industrial production: water supply in 2017
- Industrial production: water supply in 2018
- Industrial production: water supply in 2019
- Industrial production: water supply in 2020
- Industrial production: water supply in 2022
- Industrial production: water supply in 2023
- Industrial production: water supply in 2024
- Industrial production: water supply in 2025
- Industrial production: water supply in 2026