Money supply M1
Monetary aggregate M1: cash (M0) plus transferable deposits. Published monthly as of the first day of the month.
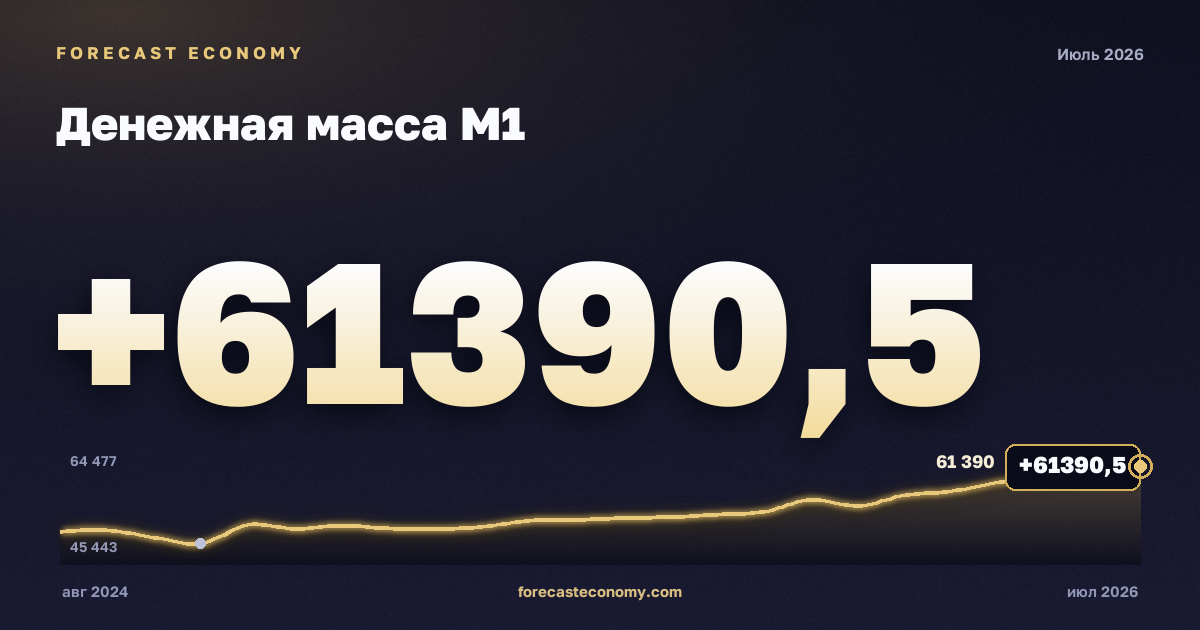
Latest value
- Latest value: 61,390.5 bln RUB
- Date of latest value: 1 July 2026
- Frequency: monthly
- Source: Bank of Russia
- Number of observations: 308
- Data period: 1 December 2000 — 1 July 2026
What it shows
Monetary aggregate M1: cash (M0) plus transferable deposits. Published monthly as of the first day of the month.
Why it matters
Money supply M1 is a reference series for analysis of the Russian economy, comparisons over time, and interpretation alongside related indicators on Forecast Economy.
How to read the chart
The chart shows the selected view of the series. Switch modes above the plot to change period-to-period, year-on-year or level presentation. The latest reading and date are on the telemetry cards.
How often it updates
The series updates when the official publisher releases new figures (monthly). The date of the latest point is shown on the chart and in the table.
Methodology
Monetary aggregate M1 in billions of rubles: cash (M0) and transferable demand deposits at month-end as estimated by the Bank of Russia. The card shows the monthly series and quarterly and annual averages; no forecast is produced. The money-aggregates family lets you switch to M0 and M2 while keeping the chart mode.
Source
Values on this page come from Bank of Russia. Chart modes reuse the same official readings under the rules described in the methodology panel.
Methodology
Monetary aggregate M1 in billions of rubles: cash (M0) and transferable demand deposits at month-end as estimated by the Bank of Russia. The card shows the monthly series and quarterly and annual averages; no forecast is produced. The money-aggregates family lets you switch to M0 and M2 while keeping the chart mode.
Latest data
| Date | Value, bln RUB |
|---|---|
| 1 July 2026 | 61,390.5 |
| 1 June 2026 | 61,312.9 |
| 1 May 2026 | 60,025.2 |
| 1 April 2026 | 58,825.6 |
| 1 March 2026 | 57,350.6 |
| 1 February 2026 | 56,646 |
| 1 January 2026 | 54,887.9 |
| 1 December 2025 | 55,914.1 |
| 1 November 2025 | 53,927.9 |
| 1 October 2025 | 53,429.8 |
| 1 September 2025 | 53,019.8 |
| 1 August 2025 | 52,882.4 |
Money supply M1 by year
Money supply M1 by month
- Money supply M1 in July 2026
- Money supply M1 in June 2026
- Money supply M1 in May 2026
- Money supply M1 in April 2026
- Money supply M1 in March 2026
- Money supply M1 in February 2026
- Money supply M1 in January 2026
- Money supply M1 in December 2025
- Money supply M1 in November 2025
- Money supply M1 in October 2025
- Money supply M1 in September 2025
- Money supply M1 in August 2025