Prices and tariffs — regional comparison
Price indices on the secondary housing market: ranking of regions, 2024
Comparison of 84 federal subjects of the Russian Federation by «Price indices on the secondary housing market» for 2024. The largest values are in: Chechen Republic (117,7 % of end of previous year), Astrakhan Oblast (116,9 % of end of previous year), Altai Republic (116,8 % of end of previous year). The smallest value is in Kemerovo Oblast – Kuzbass — 95,8 % of end of previous year. The Russia-wide figure is 106,6 % of end of previous year.
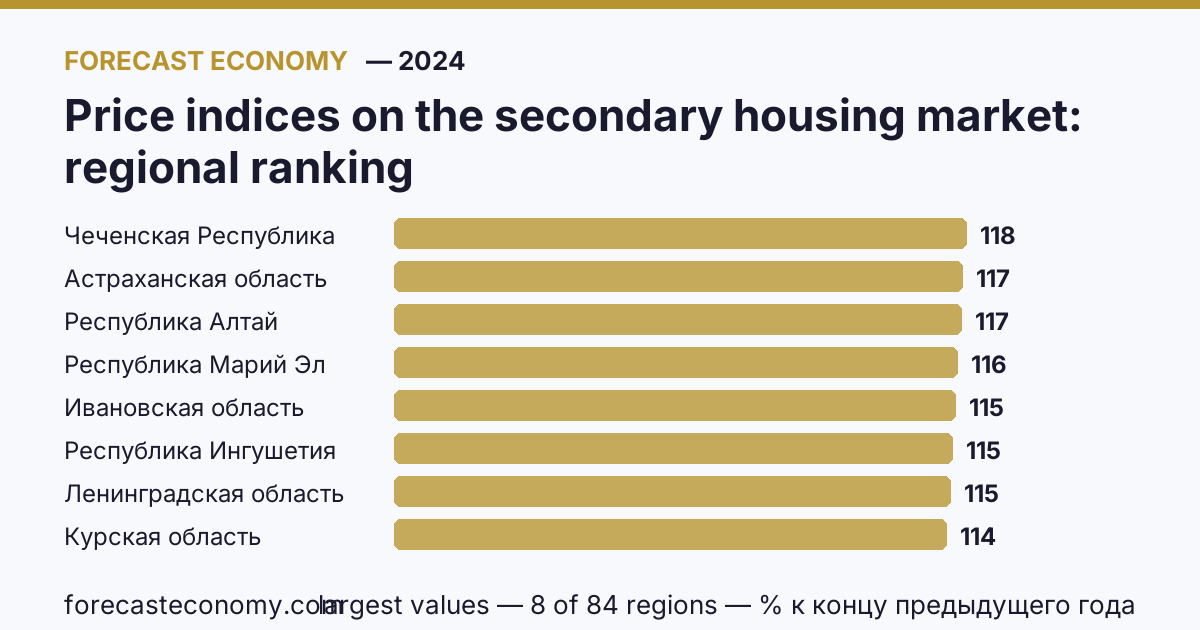
Regions by indicator magnitude (84 regions)
Questions and answers
Which region has the largest value for «Price indices on the secondary housing market»?
As of 2024, the largest value is in Chechen Republic — 117,7 % of end of previous year.
Which region has the smallest value?
The smallest value is in Kemerovo Oblast – Kuzbass — 95,8 % of end of previous year.
Which year do the figures cover, and where do they come from?
Figures for 2024 from the Rosstat yearbook "Regions of Russia. Socio-economic indicators".
On the regions map
The same indicator on an interactive map of Russia — region colours by value, year slider: open the «Price indices on the secondary housing market» map.
Other indicators in «Prices and tariffs»
- Consumer price indices
- Consumer price indices for non-food goods
- Consumer price indices for food goods
- Consumer price (tariff) indices for services
- Freight transport tariff indices
- Price indices on the primary housing market
- Producer price indices for construction output
- Industrial producer price indices by activity — total under OKVED, 2000–2016
- Industrial producer price indices by activity — total under OKVED2
- Industrial producer price indices — Mining and quarrying under OKVED, 2000–2016
- Industrial producer price indices — Mining and quarrying under OKVED2
- Industrial producer price indices — Manufacturing under OKVED, 2000–2016
Data source
Rosstat yearbook "Regions of Russia. Socio-economic indicators". Values for 2024, units: % of end of previous year. Each region has a page with the full indicator series since 1990.