Information and communication technologies — regional comparison
Household computer and Internet use — households with a computer: ranking of regions, 2024
Comparison of 85 federal subjects of the Russian Federation by «Household computer and Internet use — households with a computer» for 2024. The largest values are in: Sevastopol (93,3 % of households), Republic of Tatarstan (93,2 % of households), Republic of North Ossetia – Alania (92,8 % of households). The smallest value is in Karachay-Cherkess Republic — 40,9 % of households. The Russia-wide figure is 72,2 % of households.
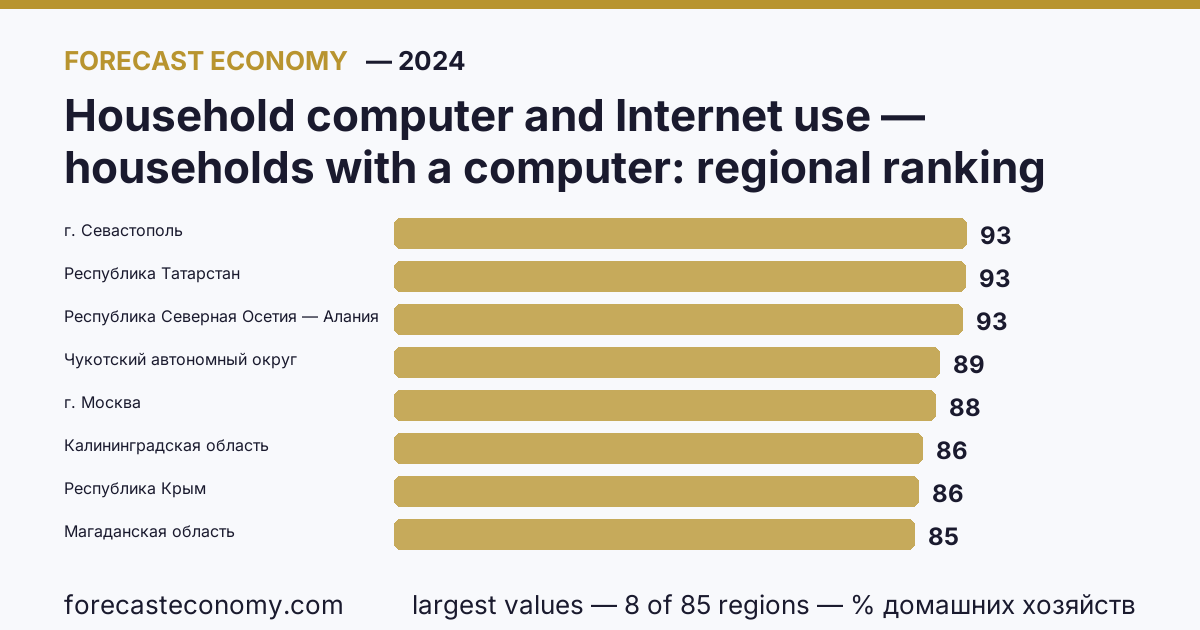
Regions by indicator magnitude (85 regions)
Questions and answers
Which region has the largest value for «Household computer and Internet use — households with a computer»?
As of 2024, the largest value is in Sevastopol — 93,3 % of households.
Which region has the smallest value?
The smallest value is in Karachay-Cherkess Republic — 40,9 % of households.
Which year do the figures cover, and where do they come from?
Figures for 2024 from the Rosstat yearbook "Regions of Russia. Socio-economic indicators".
On the regions map
The same indicator on an interactive map of Russia — region colours by value, year slider: open the «Household computer and Internet use — households with a computer» map.
Other indicators in «Information and communication technologies»
- Active broadband subscribers per 100 population — fixed broadband
- Active broadband subscribers per 100 population — mobile broadband
- Personal computers per 100 employees — with Internet access
- Personal computers per 100 employees — total
- Connected mobile subscriber devices per 1,000 population
- Electronic document management in organizations — systems used, 2011–2019
- Electronic document management in organizations — electronic data exchange with external systems
- Household computer and Internet use — households with Internet access
- Household computer and Internet use — households with broadband Internet
- Organizational use of mobile and fixed Internet
- Population Internet use — population using the Internet
- Population Internet use — daily or almost daily users
Data source
Rosstat yearbook "Regions of Russia. Socio-economic indicators". Values for 2024, units: % of households. Each region has a page with the full indicator series since 1990.