Land resources and environmental protection — Kostroma Oblast
Freshwater use in Kostroma Oblast
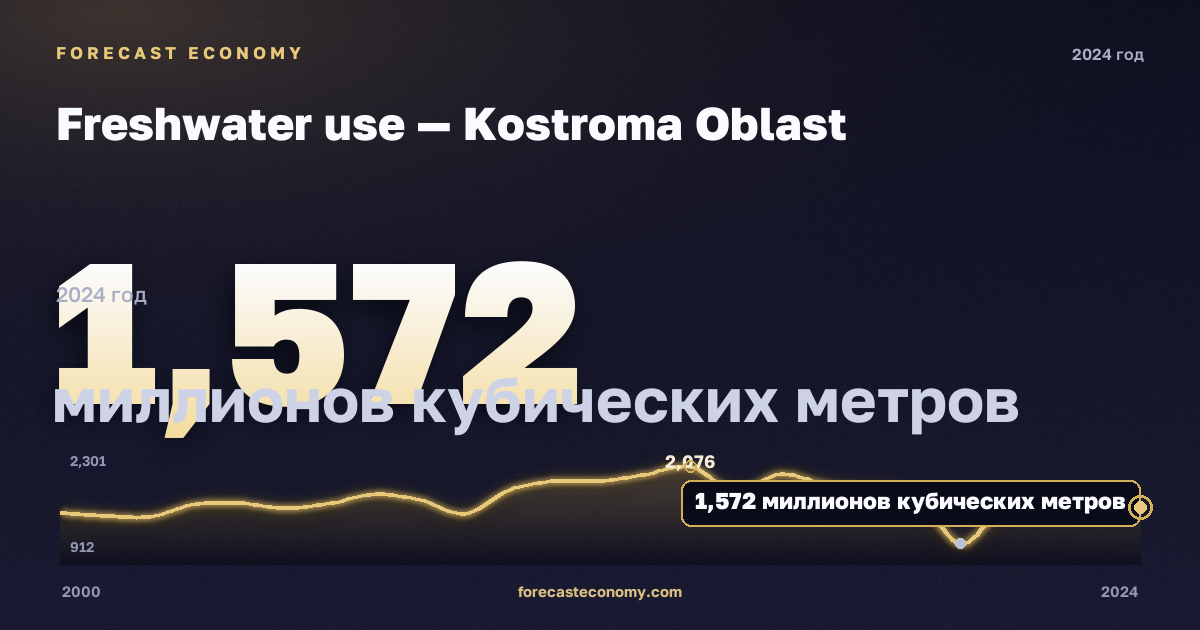
Freshwater use in Kostroma Oblast in 2024: 1 572 million cubic metres. Over the year the indicator rose by 1,6%.
Over five years (since 2019) the indicator fell by 9%. Since 2000, the start of the available series, the indicator rose by 3,8% (from 1 515 to 1 572 million cubic metres).
By this indicator Kostroma Oblast holds position 12 in the list by magnitude out of 85 in 2024 (table for all regions). The Russia-wide figure is 50 682 million cubic metres: the region is below the national average.
Maximum over the full observation period — 2 076 million cubic metres in 2014, minimum — 1 138 million cubic metres in 2020. Data are updated annually as Rosstat releases the yearbook.
Freshwater use in Kostroma Oblast at checkpoint years
- 2000 — 1 515 million cubic metres
- 2005 — 1 574 million cubic metres
- 2010 — 1 800 million cubic metres
- 2015 — 1 781 million cubic metres
- 2020 — 1 138 million cubic metres
- 2024 — 1 572 million cubic metres
Freshwater use by year
| Year | million cubic metres |
|---|---|
| 2024 | 1 572 |
| 2023 | 1 548 |
| 2022 | 1 724 |
| 2021 | 1 588 |
| 2020 | 1 138 |
| 2019 | 1 728 |
| 2018 | 1 811 |
| 2017 | 1 865 |
| 2016 | 1 988 |
| 2015 | 1 781 |
| 2014 | 2 076 |
| 2013 | 1 982 |
| 2012 | 1 907 |
| 2011 | 1 905 |
| 2010 | 1 800 |
| 2009 | 1 508 |
| 2008 | 1 671 |
| 2007 | 1 742 |
| 2006 | 1 632 |
| 2005 | 1 574 |
| 2004 | 1 635 |
| 2003 | 1 622 |
| 2002 | 1 470 |
| 2001 | 1 480 |
| 2000 | 1 515 |
Questions and answers
What is “Freshwater use” in Kostroma Oblast?
According to Rosstat for 2024 — 1 572 million cubic metres.
Where does Kostroma Oblast sit in the list by indicator magnitude?
12 of 85 federal subjects when ordered by descending value for 2024.
How did the indicator change over the last year?
From 2023 to 2024 the indicator rose by 1,6%.
Where do the data come from and how often are they updated?
Source — the official Rosstat yearbook "Regions of Russia. Socio-economic indicators". Figures are annual and update after each new yearbook release.
This indicator in neighbouring regions of the district
- Freshwater use — Belgorod Oblast
- Freshwater use — Bryansk Oblast
- Freshwater use — Vladimir Oblast
- Freshwater use — Voronezh Oblast
- Freshwater use — Ivanovo Oblast
- Freshwater use — Kaluga Oblast
- Freshwater use — Kursk Oblast
- Freshwater use — Lipetsk Oblast
- Freshwater use — Moscow Oblast
- Freshwater use — Oryol Oblast
- Freshwater use — Ryazan Oblast
- Freshwater use — Smolensk Oblast
- Freshwater use — Tambov Oblast
- Freshwater use — Tver Oblast
- Freshwater use — Tula Oblast
- Freshwater use — Yaroslavl Oblast
- Freshwater use — Moscow
More in “Land resources and environmental protection”
- Share of captured and neutralized air pollutants from stationary sources
- Volume of recycled and successively used water
- Discharge of polluted wastewater into surface water bodies
- Capture of air pollutants from stationary sources
- Air pollutant emissions from stationary sources
- Land area by type — forest land
- Land area by type — surface waters, including wetlands
- Land area by type — agricultural land
Data source
Rosstat yearbook "Regions of Russia. Socio-economic indicators". Values for 2000–2024, units: million cubic metres. Each region has a page with the full indicator series since 1990.