Industrial production — Lipetsk Oblast
Power plant capacity in Lipetsk Oblast, 2011: value and dynamics
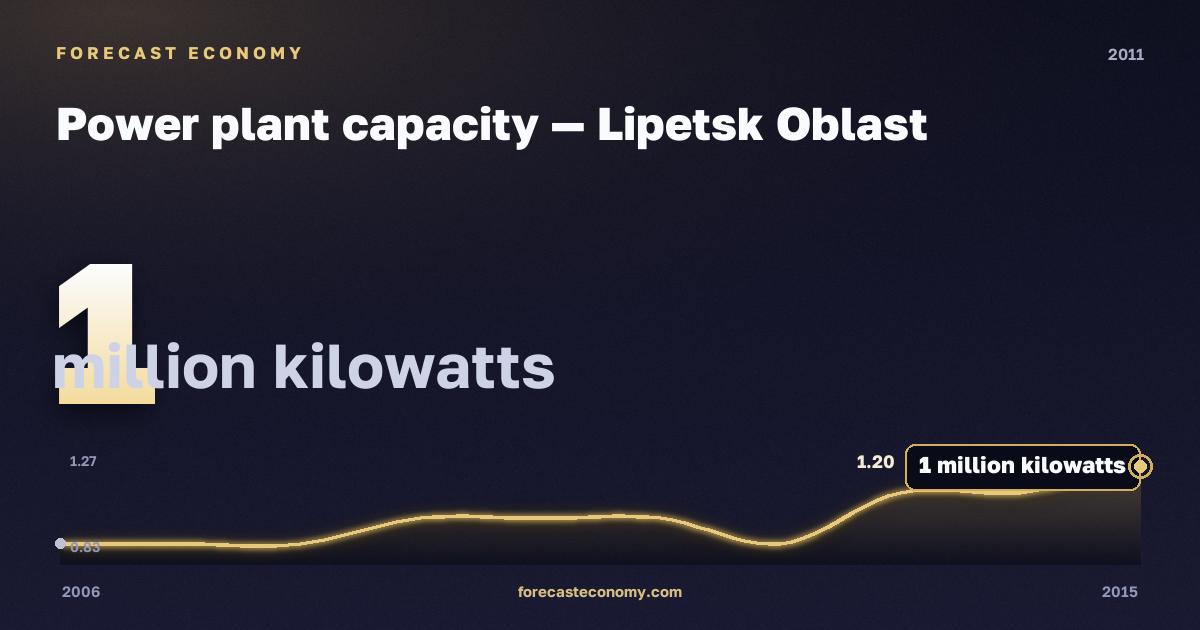
Power plant capacity in Lipetsk Oblast in 2011: 1 million kilowatts.
Change versus 2010: +0 million kilowatts (indicator was virtually unchanged).
Place among Russian regions
In 2011, Lipetsk Oblast holds position 55 in the list by magnitude out of 82 (full regional ranking).
Comparison with the Russian average
The Russian average in 2011 was 233.3 million kilowatts. The region's value is below the national average.
Dynamics over neighbouring years
| Year | million kilowatts |
|---|---|
| 2015 | 1.2 |
| 2014 | 1.1 |
| 2013 | 1.1 |
| 2012 | 0.9 |
| 2011 | 1 |
| 2010 | 1 |
| 2009 | 1 |
| 2008 | 0.9 |
| 2007 | 0.9 |
| 2006 | 0.9 |
Checkpoint years
- 2000 — 0.8 million kilowatts
- 2005 — 0.9046 million kilowatts
- 2010 — 1 million kilowatts
- 2011 — 1 million kilowatts
- 2015 — 1.2 million kilowatts
- 2020 — 1.2 million kilowatts
The last ten years
| Year | million kilowatts |
|---|---|
| 2024 | 1.2 |
| 2023 | 1.2 |
| 2022 | 1.2 |
| 2021 | 1.2487 |
| 2020 | 1.2 |
| 2019 | 1.2369 |
| 2018 | 1.2 |
| 2017 | 1.1602 |
| 2016 | 1.1 |
| 2015 | 1.2 |
Chart and full data
Full history, an interactive chart and data for all regions — on the Power plant capacity in Lipetsk Oblast page.
Other years
- Power plant capacity in 2024
- Power plant capacity in 2023
- Power plant capacity in 2022
- Power plant capacity in 2021
- Power plant capacity in 2020
- Power plant capacity in 2019
- Power plant capacity in 2018
- Power plant capacity in 2017
- Power plant capacity in 2016
- Power plant capacity in 2015
- Power plant capacity in 2014
- Power plant capacity in 2013
- Power plant capacity in 2012
- Power plant capacity in 2010
- Power plant capacity in 2009
Interactive charts, comparisons, and validated forecasts — official statistics for national economies, their regions, and available countries. Browsing is open to everyone; downloads require a free account.
Open the platform