Labour — Tyva Republic
Unemployment rate in Tyva Republic, 2012: value and dynamics
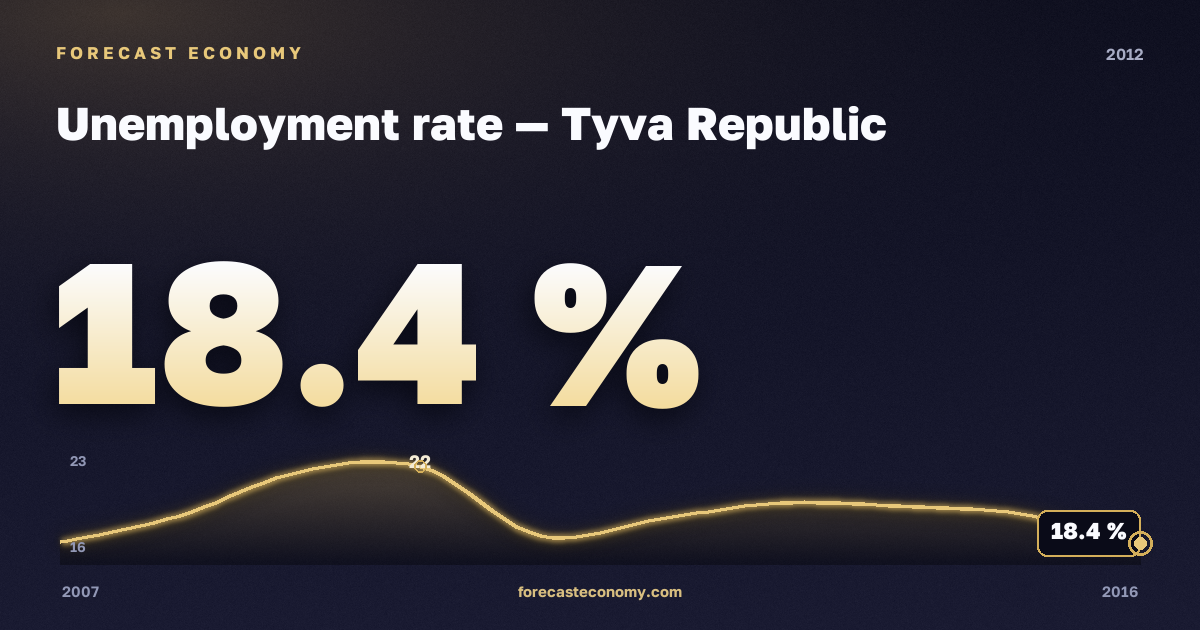
Unemployment rate in Tyva Republic in 2012: 18.4 %.
Change versus 2011: +1.1 % (indicator rose by 6.4%).
Place among Russian regions
In 2012, Tyva Republic is near the bottom of the ranking — place 81 of 83 (full regional ranking).
Comparison with the Russian average
The Russian average in 2012 was 5.5 %. The region's value is above the national average.
Dynamics over neighbouring years
| Year | % |
|---|---|
| 2016 | 16.8 |
| 2015 | 18.7 |
| 2014 | 19.2 |
| 2013 | 19.4 |
| 2012 | 18.4 |
| 2011 | 17.3 |
| 2010 | 21.7 |
| 2009 | 21.4 |
| 2008 | 18.6 |
| 2007 | 16.9 |
Checkpoint years
- 1993 — 6.5 %
- 1998 — 19.6 %
- 2003 — 20.9 %
- 2008 — 18.6 %
- 2012 — 18.4 %
- 2013 — 19.4 %
- 2018 — 14.9 %
- 2023 — 6.6 %
The last ten years
| Year | % |
|---|---|
| 2024 | 4.9 |
| 2023 | 6.6 |
| 2022 | 9.5 |
| 2021 | 15.3 |
| 2020 | 18.2 |
| 2019 | 12.5 |
| 2018 | 14.9 |
| 2017 | 18.4 |
| 2016 | 16.8 |
| 2015 | 18.7 |
Chart and full data
Full history, an interactive chart and data for all regions — on the Unemployment rate in Tyva Republic page.
Other years
- Unemployment rate in 2024
- Unemployment rate in 2023
- Unemployment rate in 2022
- Unemployment rate in 2021
- Unemployment rate in 2020
- Unemployment rate in 2019
- Unemployment rate in 2018
- Unemployment rate in 2017
- Unemployment rate in 2016
- Unemployment rate in 2015
- Unemployment rate in 2014
- Unemployment rate in 2013
- Unemployment rate in 2011
- Unemployment rate in 2010
- Unemployment rate in 2009
Interactive charts, comparisons, and validated forecasts — official statistics for national economies, their regions, and available countries. Browsing is open to everyone; downloads require a free account.
Open the platform