GDP and growth — Canada
GDP at basic prices, all industries in Canada
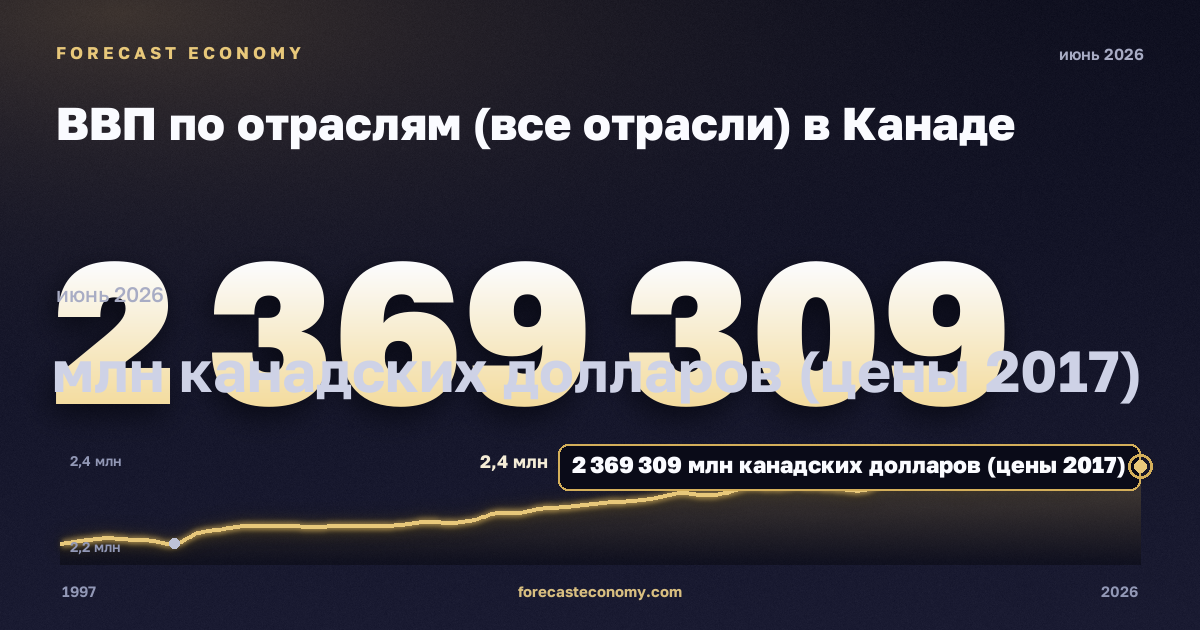
Latest value2,369,309 млн канадских долларов (цены 2017)
DateJune 2026
Period1997–2026
Data sourceStatistics Canada
GDP at basic prices, all industries in Canada: latest value 2,369,309 млн канадских долларов (цены 2017) as of June 2026.
GDP at basic prices, all industries in Canada — official series from Statistics Canada. The chart shows dynamics over the available observation period; values are shown in млн канадских долларов (цены 2017).
Observation period: 1997–2026, published monthly. Source — Statistics Canada.
Frequency
Monthly.
Latest values
| Period | млн канадских долларов (цены 2017) |
|---|---|
| June 2026 | 2,369,309 |
| May 2026 | 2,363,056 |
| April 2026 | 2,355,245 |
| March 2026 | 2,340,472 |
| February 2026 | 2,344,080 |
| January 2026 | 2,340,294 |
| December 2025 | 2,340,690 |
| November 2025 | 2,338,062 |
| October 2025 | 2,336,171 |
| September 2025 | 2,342,161 |
| August 2025 | 2,337,688 |
| July 2025 | 2,338,957 |
| June 2025 | 2,322,727 |
| May 2025 | 2,324,814 |
| April 2025 | 2,328,390 |
| March 2025 | 2,330,230 |
| February 2025 | 2,326,072 |
| January 2025 | 2,329,713 |
| December 2024 | 2,317,000 |
| November 2024 | 2,312,337 |
| October 2024 | 2,317,073 |
| September 2024 | 2,307,523 |
| August 2024 | 2,301,315 |
| July 2024 | 2,298,623 |
More in “GDP and growth” — Canada
Data source
Statistics Canada. Units: млн канадских долларов (цены 2017). Observation period: 1997–2026.
Data as of June 2026
Russia
Russian macro indicators — on the home page and in comparison.