Внешняя торговля — Canada
Merchandise exports (BOP, SA) in Canada
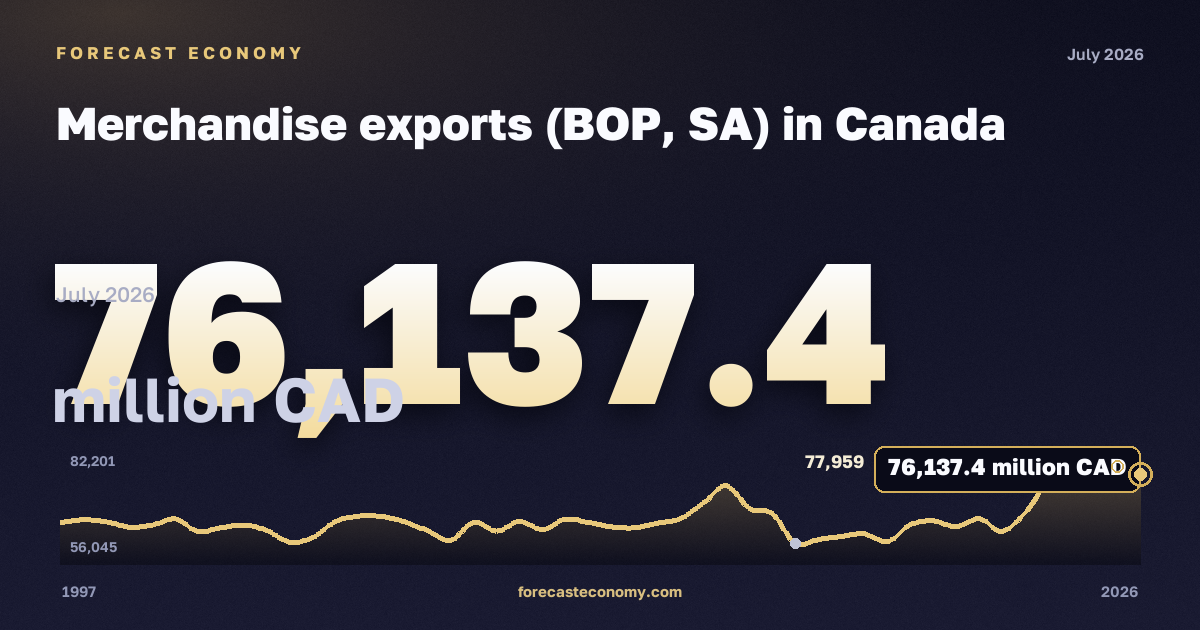
Latest value77,486.4 млн канадских долларов
DateJune 2026
Period1997–2026
Data sourceStatistics Canada
Merchandise exports (BOP, SA) in Canada: latest value 77,486.4 млн канадских долларов as of June 2026.
Merchandise exports (BOP, SA) in Canada — official series from Statistics Canada. The chart shows dynamics over the available observation period; values are shown in млн канадских долларов.
Observation period: 1997–2026, published monthly. Source — Statistics Canada.
Frequency
Monthly.
Latest values
| Period | млн канадских долларов |
|---|---|
| June 2026 | 77,486.4 |
| May 2026 | 77,187.4 |
| April 2026 | 76,644.1 |
| March 2026 | 74,146.8 |
| February 2026 | 67,312.7 |
| January 2026 | 63,091.8 |
| December 2025 | 65,961.3 |
| November 2025 | 64,135.7 |
| October 2025 | 65,481.6 |
| September 2025 | 64,570.7 |
| August 2025 | 60,679.3 |
| July 2025 | 62,531.5 |
| June 2025 | 61,908.4 |
| May 2025 | 61,186 |
| April 2025 | 60,286.1 |
| March 2025 | 67,151.5 |
| February 2025 | 68,371.2 |
| January 2025 | 73,521.4 |
| December 2024 | 69,585.3 |
| November 2024 | 66,006 |
| October 2024 | 64,989.5 |
| September 2024 | 63,893.2 |
| August 2024 | 64,124.5 |
| July 2024 | 65,096 |
Data source
Statistics Canada. Units: млн канадских долларов. Observation period: 1997–2026.
Data as of June 2026
Russia
Russian macro indicators — on the home page and in comparison.