Business and investment — Denmark
Production in construction in Denmark
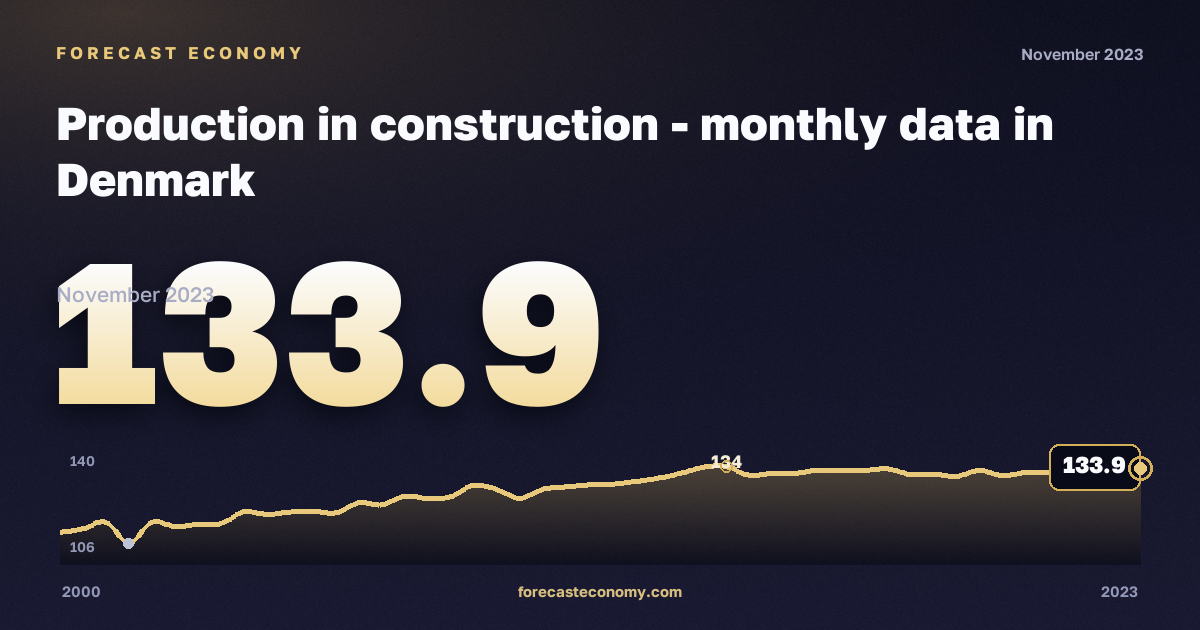
Latest value133.9
DateNovember 2023
Period2000–2023
Data sourceEurostat
Production in construction in Denmark: latest value 133.9 as of November 2023.
Production in construction in Denmark — official series from Eurostat. The chart shows dynamics over the available observation period; values are shown in index (2015 = 100).
Observation period: 2000–2023. Source — Eurostat.
Observation frequency
Latest values
| Period | index (2015 = 100) |
|---|---|
| November 2023 | 133.9 |
| October 2023 | 133.7 |
| September 2023 | 133.7 |
| August 2023 | 133.5 |
| July 2023 | 132.7 |
| June 2023 | 132.6 |
| May 2023 | 131.8 |
| April 2023 | 133.3 |
| March 2023 | 131.5 |
| February 2023 | 132.2 |
| January 2023 | 132.1 |
| December 2022 | 133.8 |
| November 2022 | 133.3 |
| October 2022 | 133.2 |
| September 2022 | 133.4 |
| August 2022 | 132.4 |
| July 2022 | 132.4 |
| June 2022 | 131.8 |
| May 2022 | 134.5 |
| April 2022 | 134.3 |
| March 2022 | 132.4 |
| February 2022 | 130.9 |
| January 2022 | 129.9 |
| December 2021 | 129.1 |
This indicator in other countries
- Production in construction — Austria
- Production in construction — Belgium
- Production in construction — Bulgaria
- Production in construction — Croatia
- Production in construction — Czechia
- Production in construction — Finland
- Production in construction — France
- Production in construction — Germany
- Production in construction — Hungary
- Production in construction — Italy
- Production in construction — Luxembourg
- Production in construction — Netherlands
More in “Business and investment” — Denmark
- General government gross fixed capital formation
- Gross domestic product at market prices
- General government gross debt
- HICP - all items - annual average indices
- General government deficit/surplus
- Individuals frequently using the internet
- Total general government revenue
- Labour input in wholesale and retail trade
- Labour input in wholesale and retail trade: wholesale trade
- Labour input in wholesale and retail trade
- Labour input in wholesale and retail trade: retail trade except fuel
- Labour input in wholesale and retail trade: wholesale and retail trade and repair of motor vehicles
Data source
Eurostat. Units: index (2015 = 100). Observation period: 2000–2023.
Data as of November 2023
Russia
Russian macro indicators — on the home page and in comparison.