Prices and inflation — Lithuania
Purchasing power parities, price level indices, nominal and real expenditures by analytical categories - based on COICOP 2018 in Lithuania
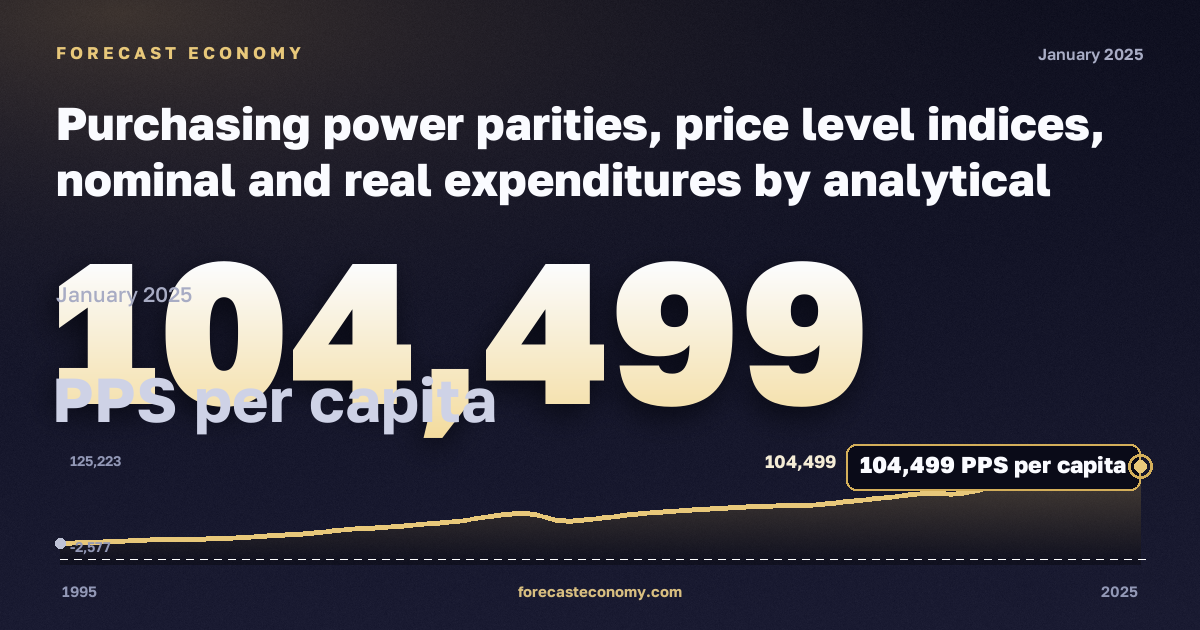
Latest value104,499 PPS per capita
Date2025
Period1995–2025
Data sourceEurostat
Purchasing power parities, price level indices, nominal and real expenditures by analytical categories - based on COICOP 2018 in Lithuania: latest value 104,499 PPS per capita as of 2025.
Purchasing power parities, price level indices, nominal and real expenditures by analytical categories - based on COICOP 2018 in Lithuania — official series from Eurostat. The chart shows dynamics over the available observation period; values are shown in ППС на душу населения.
Observation period: 1995–2025, published annually. Source — Eurostat.
Frequency
Annual.
Latest values
| Period | ППС на душу населения |
|---|---|
| 2025 | 104,499 |
| 2024 | 100,905 |
| 2023 | 94,565 |
| 2022 | 88,543 |
| 2021 | 82,221 |
| 2020 | 74,080 |
| 2019 | 74,162 |
| 2018 | 69,765 |
| 2017 | 65,589 |
| 2016 | 61,506 |
| 2015 | 60,380 |
| 2014 | 58,960 |
| 2013 | 56,778 |
| 2012 | 54,228 |
| 2011 | 51,227 |
| 2010 | 46,488 |
| 2009 | 43,403 |
| 2008 | 51,465 |
| 2007 | 48,764 |
| 2006 | 42,759 |
| 2005 | 39,503 |
| 2004 | 36,140 |
| 2003 | 33,894 |
| 2002 | 29,632 |
This indicator in other countries
- Purchasing power parities, price level indices, nominal and real expenditures by analytical categories - based on COICOP 2018 — Austria
- Purchasing power parities, price level indices, nominal and real expenditures by analytical categories - based on COICOP 2018 — Bulgaria
- Purchasing power parities, price level indices, nominal and real expenditures by analytical categories - based on COICOP 2018 — Croatia
- Purchasing power parities, price level indices, nominal and real expenditures by analytical categories - based on COICOP 2018 — Cyprus
- Purchasing power parities, price level indices, nominal and real expenditures by analytical categories - based on COICOP 2018 — Czechia
- Purchasing power parities, price level indices, nominal and real expenditures by analytical categories - based on COICOP 2018 — Denmark
- Purchasing power parities, price level indices, nominal and real expenditures by analytical categories - based on COICOP 2018 — Estonia
- Purchasing power parities, price level indices, nominal and real expenditures by analytical categories - based on COICOP 2018 — Finland
- Purchasing power parities, price level indices, nominal and real expenditures by analytical categories - based on COICOP 2018 — France
- Purchasing power parities, price level indices, nominal and real expenditures by analytical categories - based on COICOP 2018 — Germany
- Purchasing power parities, price level indices, nominal and real expenditures by analytical categories - based on COICOP 2018 — Greece
- Purchasing power parities, price level indices, nominal and real expenditures by analytical categories - based on COICOP 2018 — Hungary
More in “Prices and inflation” — Lithuania
- HICP at constant tax rates - monthly data (index) (2002-2025)
- HICP - first published data (monthly index and annual rate of change) (1996-2025)
- Inflation, average consumer prices
- Owner-occupied housing price index
- Owner-occupied housing price index
- House price index (2025 = 100)
- House sales - value and index, annual data
Data source
Eurostat. Units: ППС на душу населения. Observation period: 1995–2025.
Data for 2025
Russia
Russian macro indicators — on the home page and in comparison.