Brent crude oil
Spot price of Europe Brent crude in US dollars per barrel at the end of each trading day. Brent is a key global oil benchmark; its path is compared with other commodity benchmarks, exchange rates and interest rates.
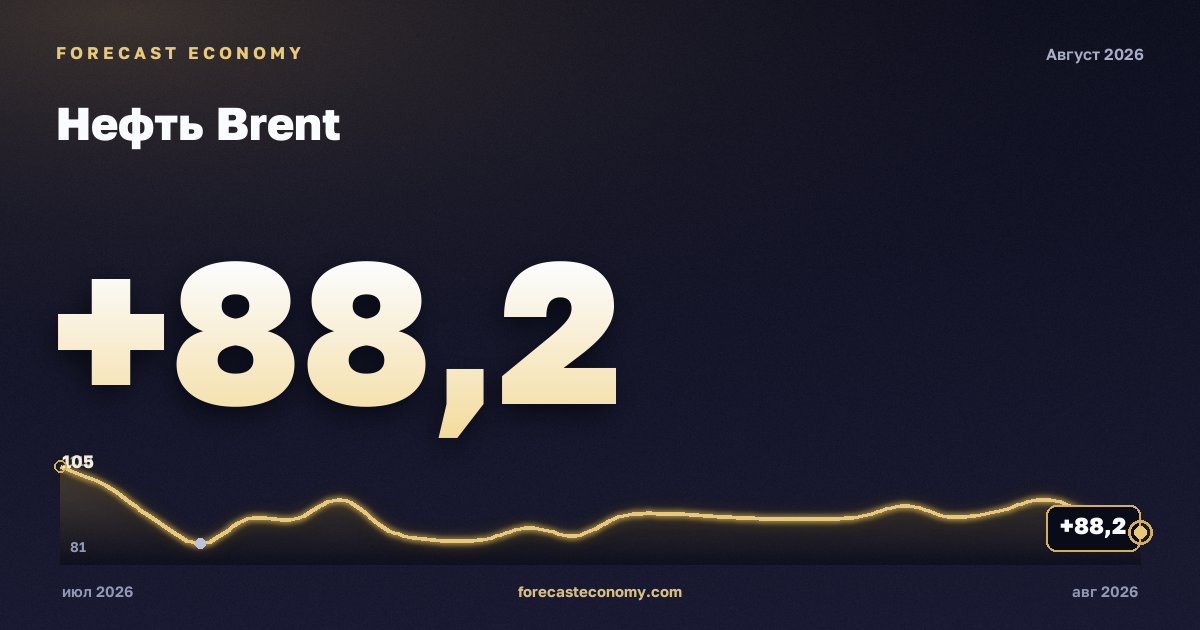
Latest value
- Latest value: 88.24 USD/баррель
- Date of latest value: 25 August 2026
- Frequency: daily
- Source: Управление энергетической информации США (EIA)
- Number of observations: 9963
- Data period: 20 May 1987 — 25 August 2026
What it shows
Spot price of Europe Brent crude in US dollars per barrel at the end of each trading day. Brent is a key global oil benchmark; its path is compared with other commodity benchmarks, exchange rates and interest rates.
Why it matters
Brent crude oil is a reference series for analysis of the Russian economy, comparisons over time, and interpretation alongside related indicators on Forecast Economy.
How to read the chart
The chart shows the selected view of the series. Switch modes above the plot to change period-to-period, year-on-year or level presentation. The latest reading and date are on the telemetry cards.
How often it updates
The series updates when the official publisher releases new figures (daily). The date of the latest point is shown on the chart and in the table.
Methodology
Official daily Europe Brent spot price FOB in US dollars per barrel from the U.S. Energy Information Administration. Each point is the value for the calendar publication day; weekends and holidays are excluded. The card offers the daily level and averages over week, month, quarter and year computed from the same series for trend comparison.
Source
Values on this page come from Управление энергетической информации США (EIA). Chart modes reuse the same official readings under the rules described in the methodology panel.
Methodology
Official daily Europe Brent spot price FOB in US dollars per barrel from the U.S. Energy Information Administration. Each point is the value for the calendar publication day; weekends and holidays are excluded. The card offers the daily level and averages over week, month, quarter and year computed from the same series for trend comparison.
Latest data
| Date | Value, USD/баррель |
|---|---|
| 25 August 2026 | 88.24 |
| 24 August 2026 | 92.71 |
| 21 August 2026 | 96.92 |
| 20 August 2026 | 94 |
| 19 August 2026 | 92.37 |
| 18 August 2026 | 95.29 |
| 17 August 2026 | 92.43 |
| 14 August 2026 | 92.02 |
| 13 August 2026 | 92.03 |
| 12 August 2026 | 92.52 |
| 11 August 2026 | 93.26 |
| 10 August 2026 | 92.74 |