Net migration
Net migration for the calendar year, in thousands of people. Rosstat data from 1990.
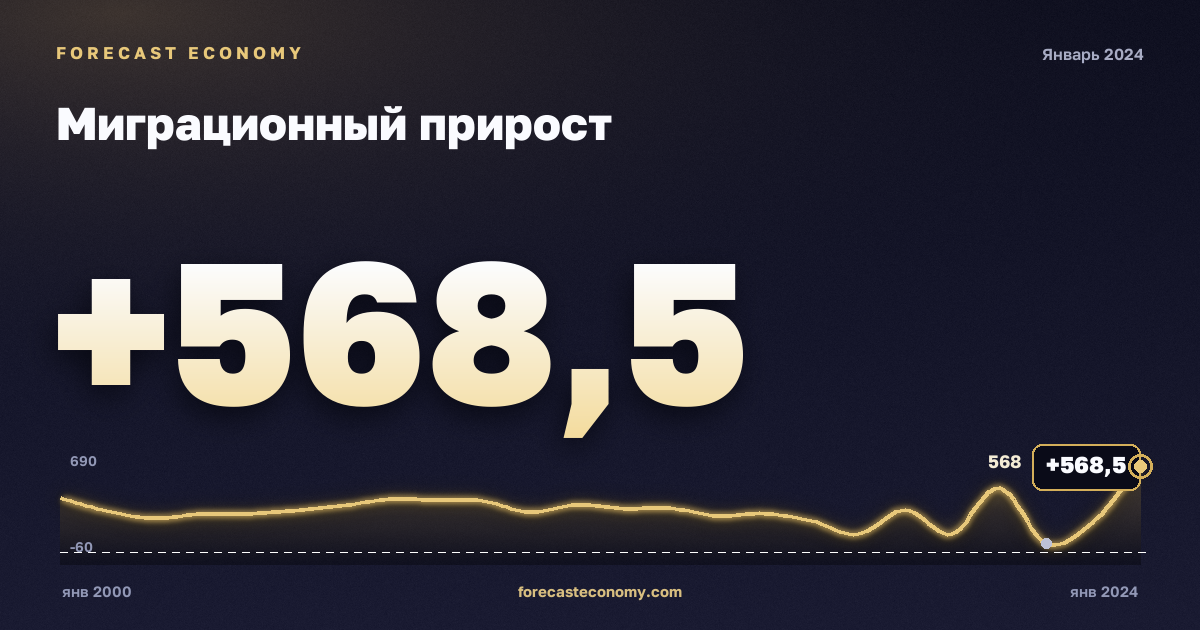
Latest value
- Latest value: 568.5 тыс. чел.
- Date of latest value: 1 January 2024
- Frequency: annual
- Source: Rosstat
- Number of observations: 34
- Data period: 1 January 1990 — 1 January 2024
What it shows
Net migration for the calendar year, in thousands of people. Rosstat data from 1990.
Why it matters
Net migration is a reference series for analysis of the Russian economy, comparisons over time, and interpretation alongside related indicators on Forecast Economy.
How to read the chart
The chart shows the selected view of the series. Switch modes above the plot to change period-to-period, year-on-year or level presentation. The latest reading and date are on the telemetry cards.
How often it updates
The series updates when the official publisher releases new figures (annual). The date of the latest point is shown on the chart and in the table.
Methodology
Difference between arrivals and departures recorded in migration statistics for the year. Source: Rosstat. Together with natural change it explains total population change.
Source
Values on this page come from Rosstat. Chart modes reuse the same official readings under the rules described in the methodology panel.
Methodology
Difference between arrivals and departures recorded in migration statistics for the year. Source: Rosstat. Together with natural change it explains total population change.
Latest data
| Date | Value, тыс. чел. |
|---|---|
| 1 January 2024 | 568.5 |
| 1 January 2023 | 203.6 |
| 1 January 2022 | 61.9 |
| 1 January 2021 | 429.9 |
| 1 January 2020 | 124.5 |
| 1 January 2019 | 285.1 |
| 1 January 2018 | 124.9 |
| 1 January 2017 | 211.8 |
| 1 January 2016 | 262 |
| 1 January 2015 | 245.4 |
| 1 January 2013 | 295.8 |
| 1 January 2012 | 295 |