Net migration in Russia, 2015
Net migration in 2015: Annual value — 245.4 ths people. Comparison with the previous year and position in the series history. Official data — Rosstat.
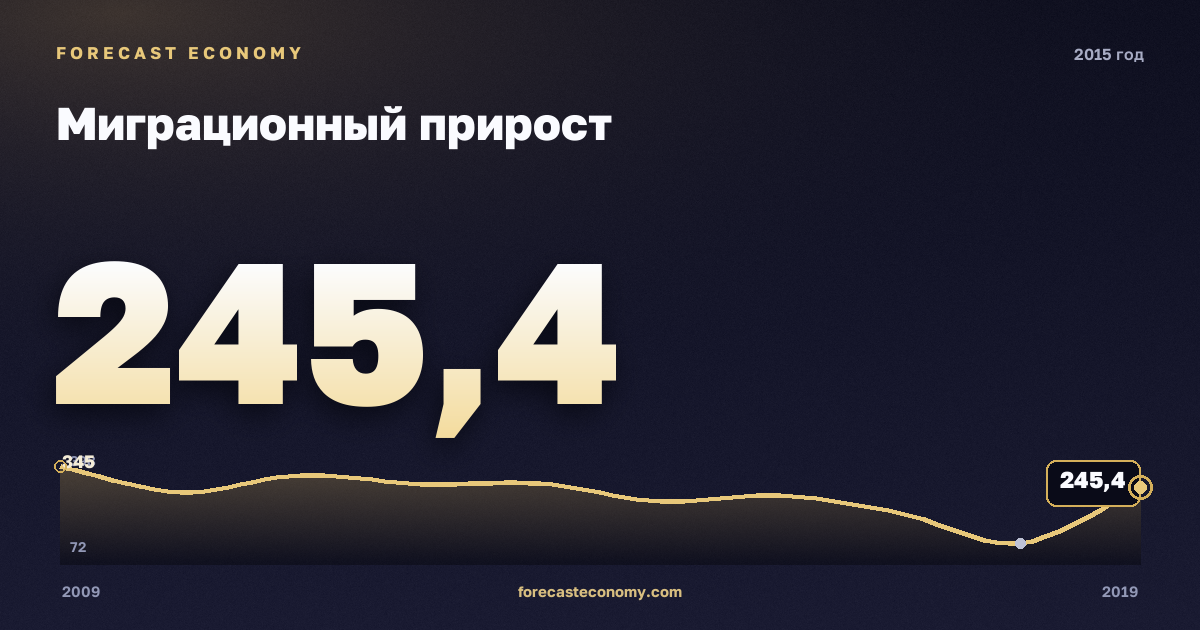
Net migration in 2015
- Value: 245.4 ths people
- Change vs previous year: no comparable value
- Position in history: below the 34-year average (average — 332.3324 ths people)
- Series maximum — 978 ths people in 1994 (21 years ago)
- Series minimum — 61.9 ths people in 2022
- Value date: 1 January 2015
- Source: Rosstat
Dynamics over neighbouring years
| Year | Value, ths people |
|---|---|
| 2009 | 345.2 |
| 2010 | 271.5 |
| 2011 | 320.1 |
| 2012 | 295 |
| 2013 | 295.8 |
| 2015 | 245.4 |
| 2016 | 262 |
| 2017 | 211.8 |
| 2018 | 124.9 |
| 2019 | 285.1 |
Chart and forecast
Full history, interactive chart and forecast — on the Net migration page.