Бизнес и инвестиции — Canada
Manufacturing sales (shipments) in Canada
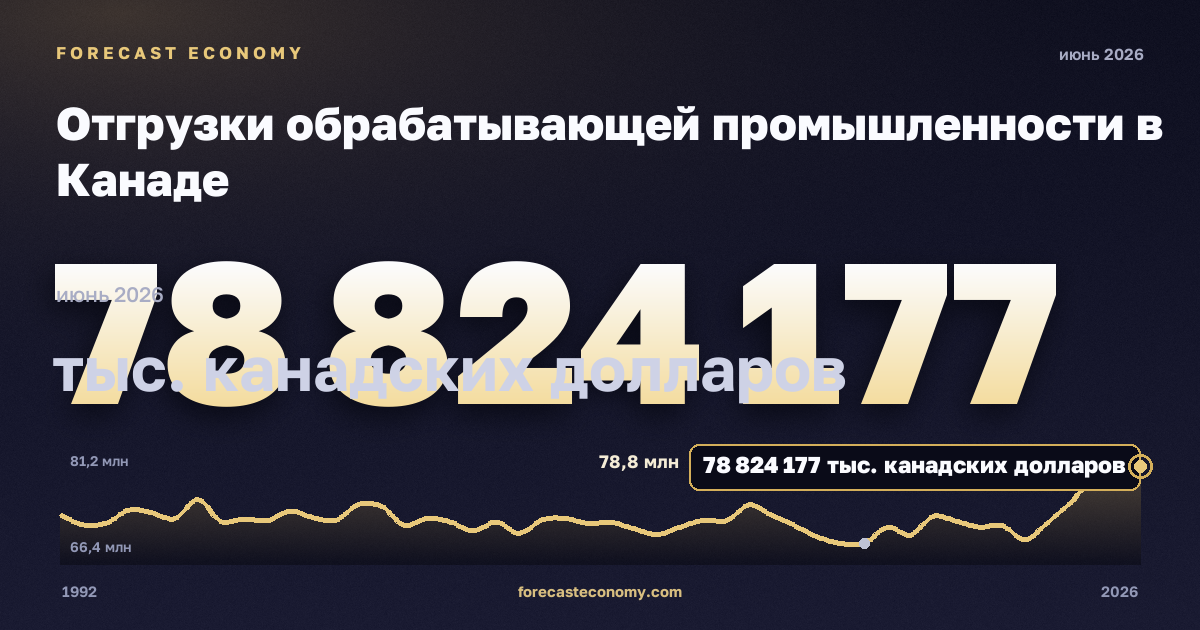
Latest value78,824,177 тыс. канадских долларов
DateJune 2026
Period1992–2026
Data sourceStatistics Canada
Manufacturing sales (shipments) in Canada: latest value 78,824,177 тыс. канадских долларов as of June 2026.
Manufacturing sales (shipments) in Canada — official series from Statistics Canada. The chart shows dynamics over the available observation period; values are shown in тыс. канадских долларов.
Observation period: 1992–2026, published monthly. Source — Statistics Canada.
Frequency
Monthly.
Latest values
| Period | тыс. канадских долларов |
|---|---|
| June 2026 | 78,824,177 |
| May 2026 | 78,752,977 |
| April 2026 | 77,506,902 |
| March 2026 | 74,154,801 |
| February 2026 | 71,619,381 |
| January 2026 | 69,300,981 |
| December 2025 | 71,138,017 |
| November 2025 | 70,954,815 |
| October 2025 | 71,734,273 |
| September 2025 | 72,346,871 |
| August 2025 | 69,934,730 |
| July 2025 | 70,942,459 |
| June 2025 | 68,838,479 |
| May 2025 | 68,843,036 |
| April 2025 | 69,639,851 |
| March 2025 | 71,102,383 |
| February 2025 | 72,439,916 |
| January 2025 | 73,836,763 |
| December 2024 | 71,799,415 |
| November 2024 | 71,863,899 |
| October 2024 | 70,972,114 |
| September 2024 | 70,000,853 |
| August 2024 | 70,730,735 |
| July 2024 | 71,570,417 |
More in “Бизнес и инвестиции” — Canada
Data source
Statistics Canada. Units: тыс. канадских долларов. Observation period: 1992–2026.
Data as of June 2026
Russia
Russian macro indicators — on the home page and in comparison.