Бизнес и инвестиции — Canada
Retail trade sales in Canada
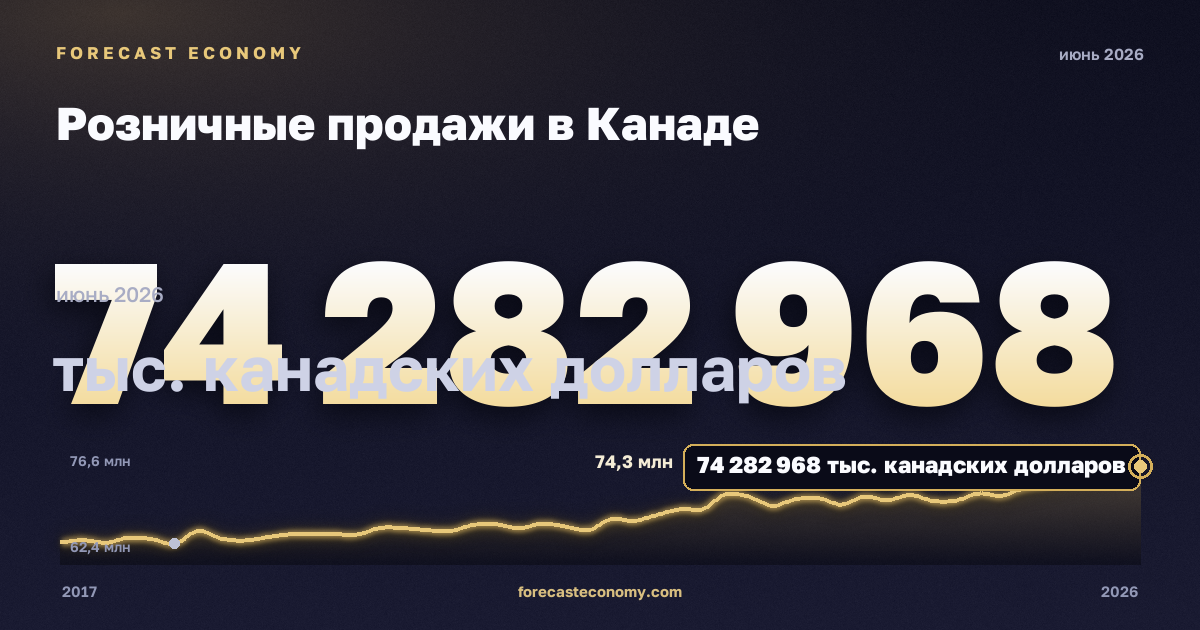
Latest value74,282,968 тыс. канадских долларов
DateJune 2026
Period2017–2026
Data sourceStatistics Canada
Retail trade sales in Canada: latest value 74,282,968 тыс. канадских долларов as of June 2026.
Retail trade sales in Canada — official series from Statistics Canada. The chart shows dynamics over the available observation period; values are shown in тыс. канадских долларов.
Observation period: 2017–2026, published monthly. Source — Statistics Canada.
Frequency
Monthly.
Latest values
| Period | тыс. канадских долларов |
|---|---|
| June 2026 | 74,282,968 |
| May 2026 | 73,838,626 |
| April 2026 | 73,065,313 |
| March 2026 | 72,725,905 |
| February 2026 | 72,053,890 |
| January 2026 | 71,650,547 |
| December 2025 | 70,708,740 |
| November 2025 | 70,985,144 |
| October 2025 | 70,112,774 |
| September 2025 | 70,059,094 |
| August 2025 | 70,780,386 |
| July 2025 | 70,134,576 |
| June 2025 | 70,579,225 |
| May 2025 | 69,612,679 |
| April 2025 | 70,413,365 |
| March 2025 | 70,269,650 |
| February 2025 | 69,400,454 |
| January 2025 | 70,573,782 |
| December 2024 | 70,891,213 |
| November 2024 | 69,070,294 |
| October 2024 | 69,041,870 |
| September 2024 | 68,321,269 |
| August 2024 | 67,604,219 |
| July 2024 | 67,786,847 |
More in “Бизнес и инвестиции” — Canada
Data source
Statistics Canada. Units: тыс. канадских долларов. Observation period: 2017–2026.
Data as of June 2026
Russia
Russian macro indicators — on the home page and in comparison.