Country comparison
Gross domestic product at current prices: China vs Croatia
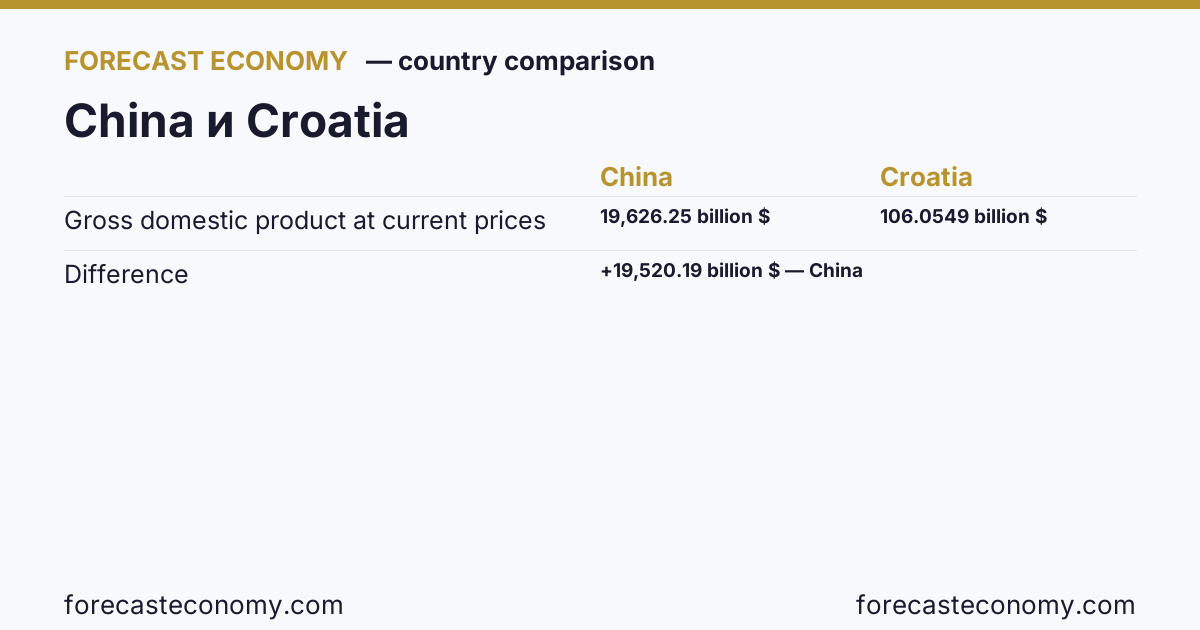
Latest data: China — 19,626.25 billion $, Croatia — 106.0549 billion $ (as of 2025). China is higher by 19,520.19 billion $.
Latest values
Units: billion $.
| Date | China | Croatia |
|---|---|---|
| 2014 | 10,702.46 | 59.6225 |
| 2015 | 11,305.64 | 51.005 |
| 2016 | 11,452 | 52.6364 |
| 2017 | 12,516.15 | 56.1637 |
| 2018 | 14,107.93 | 61.6939 |
| 2019 | 14,593.45 | 61.4738 |
| 2020 | 15,110.19 | 57.9143 |
| 2021 | 18,183.5 | 69.0517 |
| 2022 | 18,337.78 | 71.2568 |
| 2023 | 18,366.94 | 85.6471 |
| 2024 | 18,945.11 | 92.9554 |
| 2025 | 19,626.25 | 106.0549 |
Compare live
Interactive comparison of the two series with period and mode controls — on the comparison page. Country profiles: China, Croatia.
Other indicators to compare
Data source
Latest published value in each calendar year
Data for 2025
Source: International Monetary Fund.
Interactive charts, comparisons, and validated forecasts — official statistics for national economies, their regions, and available countries. Browsing is open to everyone; downloads require a free account.
Open the platform