Country comparison
Economic activity rate: Australia vs Austria
Latest data: Australia — 66.8533 % (as of July 2026), Austria — 78.9 % (as of 2025). Austria is higher by 12.0467 pp.
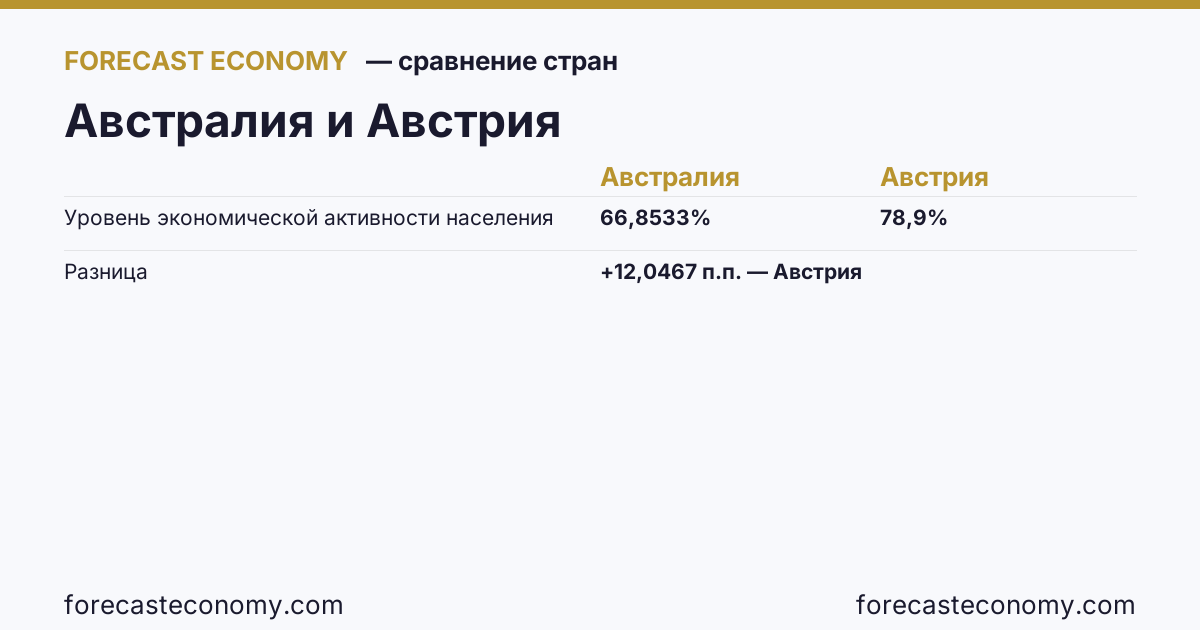
Latest values
Units: % (Australia), % of population (Austria).
| Date | Australia | Austria |
|---|---|---|
| 1 August 2025 | 66.8308 | 78.9 |
| 1 September 2025 | 66.9028 | 78.9 |
| 1 October 2025 | 66.8979 | 78.9 |
| 1 November 2025 | 66.6301 | 78.9 |
| 1 December 2025 | 66.667 | 78.9 |
| 1 January 2026 | 66.6849 | 78.9 |
| 1 February 2026 | 66.8196 | 78.9 |
| 1 March 2026 | 66.7747 | 78.9 |
| 1 April 2026 | 66.6793 | 78.9 |
| 1 May 2026 | 66.6931 | 78.9 |
| 1 June 2026 | 67.0109 | 78.9 |
| 1 July 2026 | 66.8533 | 78.9 |
Values are shown as of the nearest publication date; latest slice: Australia — July 2026, Austria — 2025.
Compare live
Interactive comparison of the two series with period and mode controls — on the comparison page. Country profiles: Australia, Austria.
Other indicators to compare
Data source
Latest published value in each calendar year
Data as of July 2026
Source: Australian Bureau of Statistics and Eurostat.
Interactive charts, comparisons, and validated forecasts — official statistics for national economies, their regions, and available countries. Browsing is open to everyone; downloads require a free account.
Open the platform