Country comparison
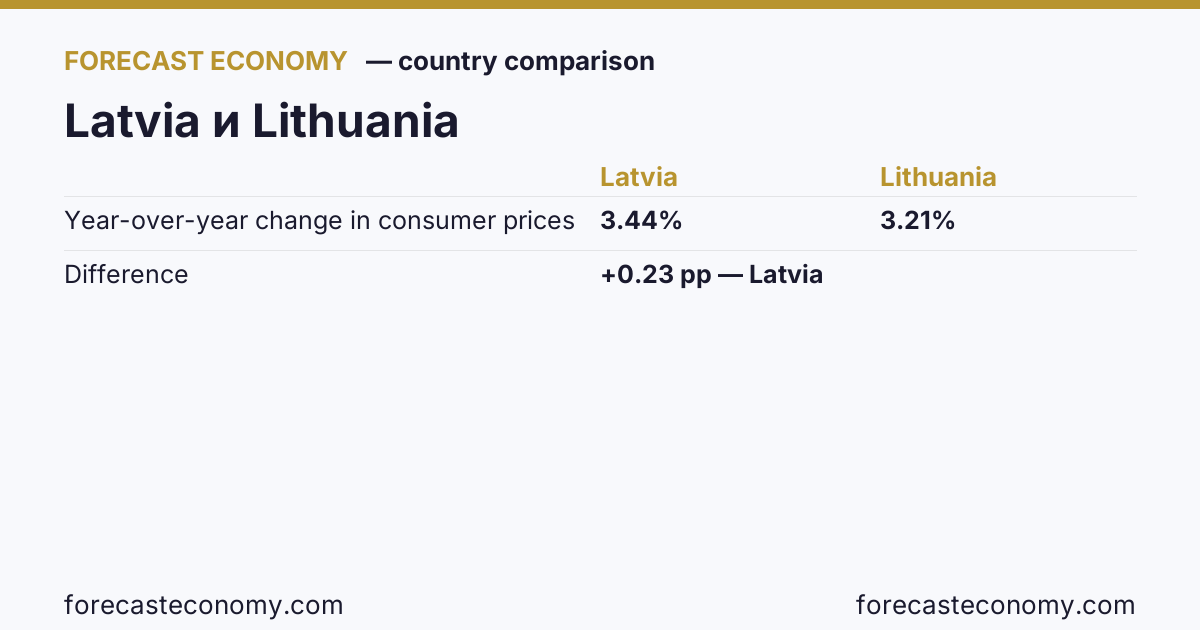
Year-over-year change in consumer prices: Latvia vs Lithuania
Latest data: Latvia — 3.44 %, Lithuania — 3.21 % (as of December 2025). Latvia is higher by 0.23 pp.
Latest values
Units: year-over-year change, %.
| Date | Latvia | Lithuania |
|---|---|---|
| January 2025 | 3.06 | 3.39 |
| February 2025 | 3.73 | 3.17 |
| March 2025 | 3.46 | 3.67 |
| April 2025 | 4.04 | 3.61 |
| May 2025 | 3.69 | 3.02 |
| June 2025 | 3.91 | 3.19 |
| July 2025 | 3.94 | 3.44 |
| August 2025 | 4.2 | 3.63 |
| September 2025 | 4.15 | 3.7 |
| October 2025 | 4.28 | 3.74 |
| November 2025 | 3.81 | 3.56 |
| December 2025 | 3.44 | 3.21 |
Compare live
Interactive comparison of the two series with period and mode controls — on the comparison page. Country profiles: Latvia, Lithuania.
Other indicators to compare
Data source
Change versus the same period of the previous year; for each calendar year — the latest available observation
Data as of December 2025
Source: Eurostat.
Interactive charts, comparisons, and validated forecasts — official statistics for national economies, their regions, and available countries. Browsing is open to everyone; downloads require a free account.
Open the platform