Country comparison
Gross domestic product at current prices: Czechia vs Denmark
Latest data: Czechia — 389.0199 billion $, Denmark — 461.7183 billion $ (as of 2025). Denmark is higher by 72.6984 billion $.
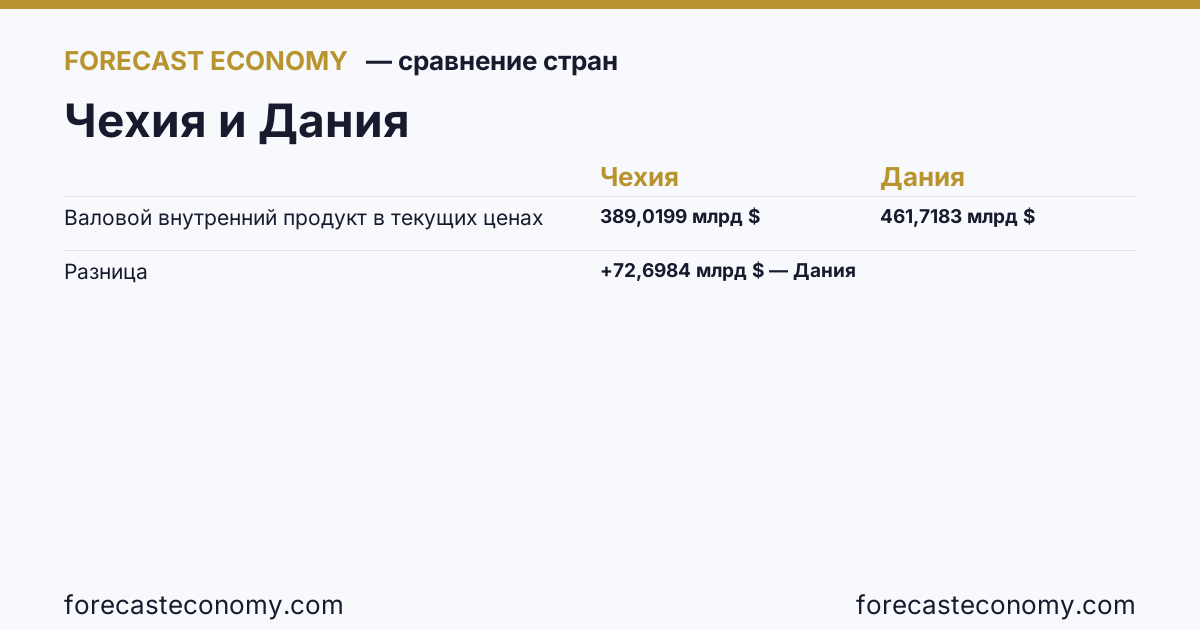
Latest values
Units: billion $.
| Date | Czechia | Denmark |
|---|---|---|
| 2014 | 210.9113 | 352.8327 |
| 2015 | 189.1077 | 301.7589 |
| 2016 | 198.1607 | 312.182 |
| 2017 | 221.5636 | 331.6105 |
| 2018 | 251.9924 | 355.2933 |
| 2019 | 256.7942 | 345.4015 |
| 2020 | 251.1097 | 355.6307 |
| 2021 | 290.9727 | 406.1101 |
| 2022 | 301.8312 | 400.1146 |
| 2023 | 345.0593 | 404.6519 |
| 2024 | 347.0826 | 424.5247 |
| 2025 | 389.0199 | 461.7183 |
Compare live
Interactive comparison of the two series with period and mode controls — on the comparison page. Country profiles: Czechia, Denmark.
Other indicators to compare
Data source
Latest published value in each calendar year
Data for 2025
Source: International Monetary Fund.
Interactive charts, comparisons, and validated forecasts — official statistics for national economies, their regions, and available countries. Browsing is open to everyone; downloads require a free account.
Open the platform