Comparable country indicators
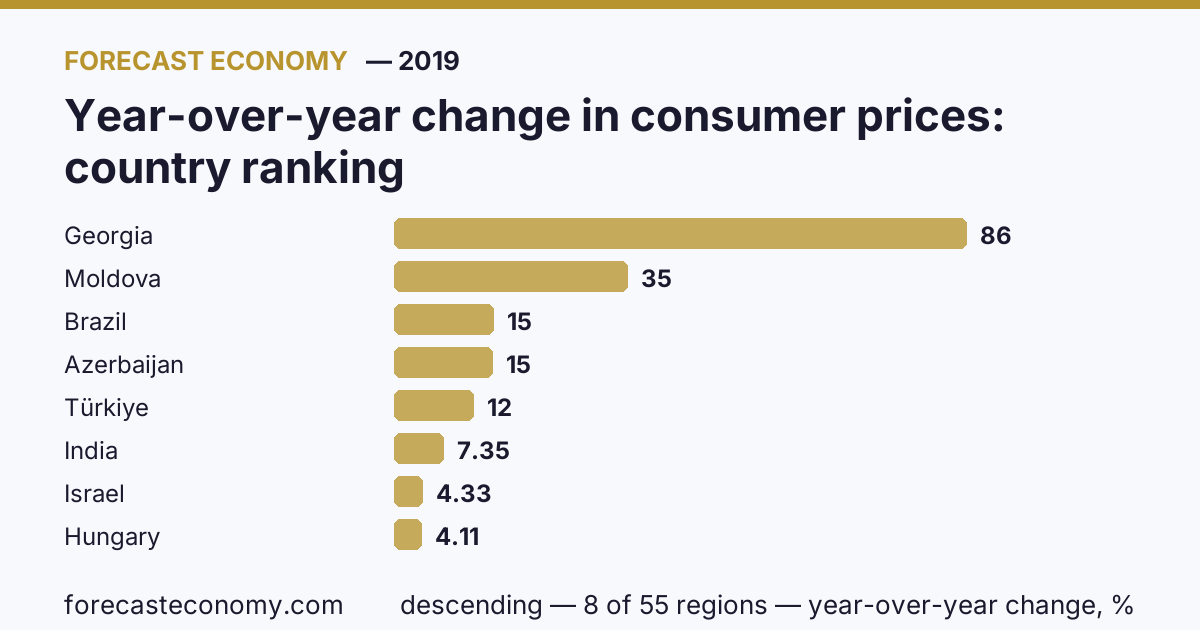
Country ranking by year-over-year change in consumer prices, 2019
Country ranking by “Year-over-year change in consumer prices” for 2019. The table covers 55 countries with a published value; another 0 in the world catalogue have no value for this year. Consumer price change over the year is compared in percent: national index base periods cancel out in this calculation, so figures are comparable across countries. For Russia the comparison uses year-on-year consumer price change from Rosstat (the consumer price index); for other countries — Eurostat’s harmonised index or a national price index. Basket compositions differ; the ranking compares the relative change over the year, not the index level and not the month-on-month change.
Full country ranking
| Rank | Country | Year-over-year change, % | Period |
|---|---|---|---|
| 1 | Georgia | 85.56 | 2019 |
| 2 | Moldova | 34.97 | 2019 |
| 3 | Brazil | 14.93 | December 2019 |
| 4 | Azerbaijan | 14.73 | 2019 |
| 5 | Türkiye | 11.84 | December 2019 |
| 6 | India | 7.35 | December 2019 |
| 7 | Israel | 4.33 | 2019 |
| 8 | Hungary | 4.11 | December 2019 |
| 9 | Romania | 4.05 | December 2019 |
| 10 | Czechia | 3.23 | December 2019 |
| 11 | Slovakia | 3.17 | December 2019 |
| 12 | Bulgaria | 3.1 | December 2019 |
| 13 | Russia | 3.05 | December 2019 |
| 14 | Poland | 3.01 | December 2019 |
| 15 | Mexico | 2.83 | December 2019 |
| 16 | Netherlands | 2.8 | December 2019 |
| 17 | Lithuania | 2.73 | December 2019 |
| 18 | China | 2.55 | December 2019 |
| 19 | United States | 2.32 | December 2019 |
| 20 | Canada | 2.25 | December 2019 |
| 21 | Latvia | 2.14 | December 2019 |
| 22 | Serbia | 2.05 | December 2019 |
| 23 | Slovenia | 1.96 | December 2019 |
| 24 | Australia | 1.84 | October 2019 |
| 25 | Austria | 1.83 | December 2019 |
| 26 | Luxembourg | 1.81 | December 2019 |
| 27 | Estonia | 1.79 | December 2019 |
| 28 | Sweden | 1.74 | December 2019 |
| 29 | France | 1.61 | December 2019 |
| 30 | Germany | 1.53 | December 2019 |
| 31 | Albania | 1.45 | December 2019 |
| 32 | New Zealand | 1.33 | 2019 |
| 33 | United Kingdom | 1.31 | December 2019 |
| 34 | Malta | 1.28 | December 2019 |
| 35 | Croatia | 1.27 | December 2019 |
| 36 | Norway | 1.17 | December 2019 |
| 37 | Finland | 1.14 | December 2019 |
| 38 | Montenegro | 1.14 | December 2019 |
| 39 | Ireland | 1.09 | December 2019 |
| 40 | Greece | 1.05 | December 2019 |
| 41 | Belgium | 0.92 | December 2019 |
| 42 | Iceland | 0.91 | December 2019 |
| 43 | Spain | 0.85 | December 2019 |
| 44 | Denmark | 0.79 | December 2019 |
| 45 | Cyprus | 0.73 | December 2019 |
| 46 | Italy | 0.48 | December 2019 |
| 47 | Portugal | 0.37 | December 2019 |
| 48 | Switzerland | −0.07 | December 2019 |
| 49 | North Macedonia | −0.19 | December 2019 |
| 50 | South Africa | −10.46 | 2019 |
| 51 | Ukraine | −27.96 | 2019 |
| 52 | Armenia | −43.16 | 2019 |
| 53 | Japan | −52.71 | 2019 |
| 54 | Bosnia and Herzegovina | −60.56 | 2019 |
| 55 | South Korea | −74.05 | 2019 |
Other ranking indicators
- Harmonised index of consumer prices
- Unemployment rate
- General government budget balance
- General government gross debt
- Population
- Long-term government bond yield
- Economic activity rate
- GDP per capita relative to the EU average
- Gross domestic product at current prices
- Gross domestic product per capita at current prices
Other years
Data source
International Monetary Fund, Central Bank of Brazil, Eurostat, Ministry of Statistics and Programme Implementation, Rosstat, Bank of Mexico, National Bureau of Statistics of China, Federal Reserve Bank of St. Louis, Statistics Canada, Australian Bureau of Statistics and Office for National Statistics. Units: year-over-year change, %. For each calendar year the last published value within the year is used.
Data as of December 2019